
Essentials of Statistics for Business and Economics (with XLSTAT Printed Access Card)
8th Edition
ISBN: 9781337114172
Author: David R. Anderson, Dennis J. Sweeney, Thomas A. Williams, Jeffrey D. Camm, James J. Cochran
Publisher: Cengage Learning
expand_more
expand_more
format_list_bulleted
Concept explainers
Videos
Textbook Question
Chapter 13, Problem 40SE
Fuel Efficiency of Gasoline Brands. A research firm tests the miles-per-gallon characteristics of three brands of gasoline. Because of different gasoline performance characteristics in different brands of automobiles, five brands of automobiles are selected and treated as blocks in the experiment: that is, each brand of automobile is tested with each type of gasoline. The results of the experiment (in miles per gallon) follow.
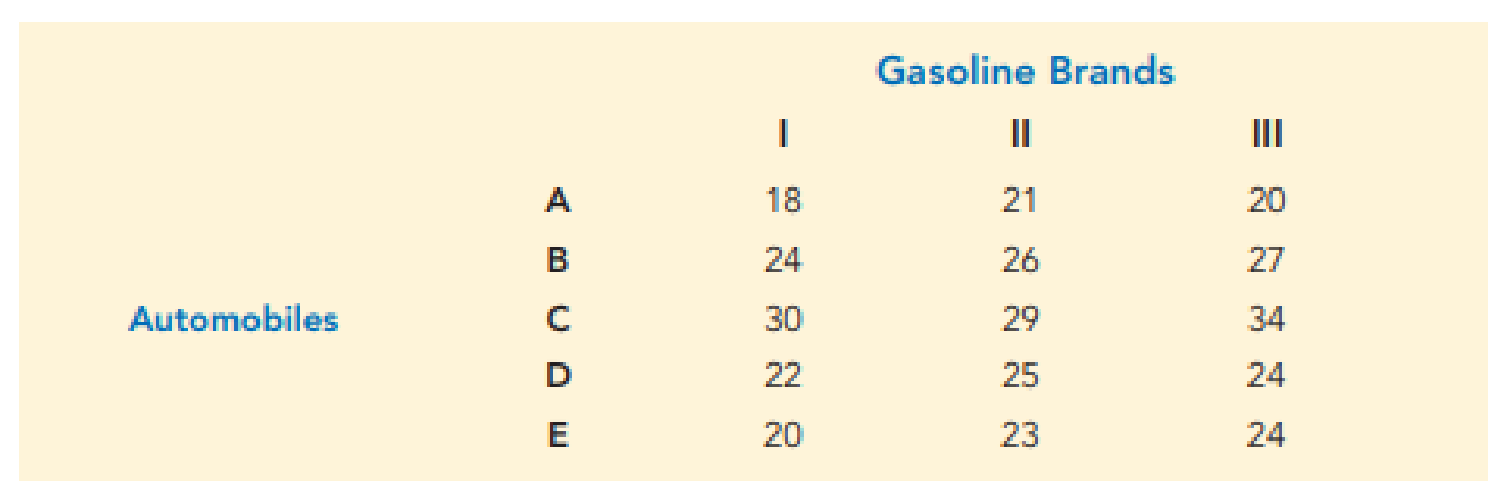
- a. At α = .05, is there a significant difference in the
mean miles-per-gallon characteristics of the three brands of gasoline? - b. Analyze the experimental data using the ANOVA procedure for completely randomized designs. Compare your findings with those obtained in part (a). What is the advantage of attempting to remove the block effect?
Expert Solution & Answer

Trending nowThis is a popular solution!

Students have asked these similar questions
1. A new drug for pain relief is being tested within a given palliative care population. The new drug is being compared to an already approved pain relief drug that is commonly used in providing palliative care to patients who experience chronic severe pain. Assume the patients are asked to rate the pain on a scale from 1 to 10, and the data presented below was obtained from a small study designed to compare the effectiveness of the two drugs. Set up and interpret the results of a Mann-Whitney U test with an alpha of .05.Pain Rating as Reported by PatientsOld Drug 1 3 3 4 6 New Drug 1 2 3 3 7
A) We fail to reject H0, which states the two populations are equal at the alpha equals .05 level because the calculated U value of 10.5 is greater than the critical U value of 2.B) We fail to reject H0, which states the two populations are equal at the alpha equals .05 level because the calculated U value of 14.5 is greater than the critical U value of 2.C) We reject H0 in favor of H1, which…
1. A new drug for pain relief is being tested within a given palliative care population. The new drug is being compared to an already approved pain relief drug that is commonly used in providing palliative care to patients who experience chronic severe pain. Assume the patients are asked to rate the pain on a scale from 1 to 10, and the data presented below was obtained from a small study designed to compare the effectiveness of the two drugs. Set up and interpret the results of a Mann-Whitney U test with an alpha of .05.Pain Rating as Reported by PatientsOld Drug 1 2 2 4 6New Drug 1 2 2 3 7Total Sample(Ordered Smallest to Largest)RanksOld Drug New DrugOld Drug New Drug Old Drug New Drug1 1 1 1 1.5 1.52 2 2 2 4.5 4.52 2 2 2 4.5 4.5
1. A new drug for pain relief is being tested within a given palliative care population. The new drug is being compared to an already approved pain relief drug that is commonly used in providing palliative care to patients who experience chronic severe pain. Assume the patients are asked to rate the pain on a scale from 1 to 10, and the data presented below was obtained from a small study designed to compare the effectiveness of the two drugs. Set up and interpret the results of a Mann-Whitney U test with an alpha of .05.
Pain Rating as Reported by Patients
Old Drug 1 2 2 4 6
New Drug 1 2 2 3 7
Old Drug
New Drug
Total Sample
(Ordered Smallest to Largest)
Ranks
Old Drug
New Drug
Old Drug
New Drug
1
1
1
1
1.5
1.5
2
2
2
2
4.5
4.5
2
2
2
2
4.5
4.5
4
3
3
7
6
7
4
8…
Chapter 13 Solutions
Essentials of Statistics for Business and Economics (with XLSTAT Printed Access Card)
Ch. 13.2 - The following data are from a completely...Ch. 13.2 - 2. In a completely randomized design, seven...Ch. 13.2 - 3. Refer to exercise 2.
what hypotheses are...Ch. 13.2 - 4. In an experiment designed to test the output...Ch. 13.2 - 5. In a completely randomized design, 12...Ch. 13.2 - Develop the analysis of variance computations for...Ch. 13.2 - 7. Three different methods for assembling a...Ch. 13.2 - 8. Refer to the NCP data in Table 13.4. Set up the...Ch. 13.2 - To study the effect of temperature on yield in a...Ch. 13.2 - Prob. 10E
Ch. 13.2 - Prob. 11ECh. 13.2 - Restaurant Satisfaction. The Consumer Reports...Ch. 13.3 - The following data are from a completely...Ch. 13.3 - The following data are from a completely...Ch. 13.3 - Testing Chemical Processes. To test whether the...Ch. 13.3 - Confidence Intervals for Different Processes....Ch. 13.3 - Prob. 17ECh. 13.3 - Machine Breakdowns. To test for any significant...Ch. 13.3 - Testing Time to Breakdown Between All Pairs of...Ch. 13.3 - Minor league Baseball Attendance. The...Ch. 13.4 - Consider the experimental results for the...Ch. 13.4 - Prob. 22ECh. 13.4 - An experiment has been conducted for four...Ch. 13.4 - Auto Tune-Ups. An automobile dealer conducted a...Ch. 13.4 - Prob. 25ECh. 13.4 - SAT Performance. The Scholastic Aptitude Test...Ch. 13.4 - Prob. 27ECh. 13.5 - A factorial experiment involving two levels of...Ch. 13.5 - The calculations for a factorial experiment...Ch. 13.5 - Prob. 30ECh. 13.5 - Amusement Park Queues. An amusement park studied...Ch. 13.5 - Auto Fuel Efficiency. As part of a study designed...Ch. 13.5 - Tax Research. A study reported in The Accounting...Ch. 13 - Paper Towel Absorption. In a completely randomized...Ch. 13 - Job Satisfaction. A study reported in the Journal...Ch. 13 - Prob. 36SECh. 13 - College Attendance Rates. The following data show...Ch. 13 - Assembly Methods. Three different assembly methods...Ch. 13 - In a study conducted to investigate browsing...Ch. 13 - Fuel Efficiency of Gasoline Brands. A research...Ch. 13 - Prob. 41SECh. 13 - Golf Club Design. A major manufacturer of golf...Ch. 13 - Language Translation. A factorial experiment was...Ch. 13 - Defective Parts. A manufacturing company designed...Ch. 13 - CASE PROBLEM 1: WENTWORTH MEDICAL CENTER As part...Ch. 13 - CASE PROBLEM 2: COMPENSATION FOR SALES...
Knowledge Booster


Learn more about
Need a deep-dive on the concept behind this application? Look no further. Learn more about this topic, statistics and related others by exploring similar questions and additional content below.Similar questions
- [4-5] CONSIDER that the data is UNCORRELATED use alpha .05. Provide the following: CI of the F value Statistical Interpretationarrow_forwardBlood cocaine concentration (mg/L) was determinedboth for a sample of individuals who had died fromcocaine-induced excited delirium (ED) and for a sampleof those who had died from a cocaine overdose withoutexcited delirium; survival time for people in bothgroups was at most 6 hours. The accompanying datawas read from a comparative boxplot in the article“Fatal Excited Delirium Following Cocaine Use” (J.of Forensic Sciences, 1997: 25–31). ED 0 0 0 0 .1 .1 .1 .1 .2 .2 .3 .3.3 .4 .5 .7 .8 1.0 1.5 2.7 2.83.5 4.0 8.9 9.2 11.7 21.0Non-ED 0 0 0 0 0 .1 .1 .1 .1 .2 .2 .2.3 .3 .3 .4 .5 .5 .6 .8 .9 1.01.2 1.4 1.5 1.7 2.0 3.2 3.5 4.14.3 4.8 5.0 5.6 5.9 6.0 6.4 7.98.3 8.7 9.1 9.6 9.9 11.0 11.512.2 12.7 14.0 16.6 17.8 a. Determine the medians, fourths, and fourth spreadsfor the two samples.b. Are there any outliers in either sample? Any extremeoutliers?c. Construct a comparative boxplot, and use it as abasis for comparing and contrasting the ED andnon-ED samples.arrow_forwardA deficiency of the trace element selenium in the diet can negatively impact growth, immunity, muscle and neuromuscular function, and fertility. The introduction of selenium supplements to dairy cows is justified when pastures have low selenium levels. Authors of a research paper supplied the following data on milk selenium concentration (mg/L) for a sample of cows given a selenium supplement (the treatment group) and a control sample given no supplement, both initially and after a 9-day period. Initial Measurement Treatment Control 11.2 9.1 9.6 8.7 10.1 9.7 8.5 10.8 10.3 10.9 10.6 10.6 11.7 10.1 9.7 12.3 10.8 8.8 10.3 10.4 10.4 10.9 11.2 10.4 9.4 11.6 10.6 10.9 10.7 8.4 After 9 Days Treatment Control 138.3 9.3 104 8.7 96.4 8.7 89 10.1 88 9.6 103.8 8.6 147.3 10.2 97.1 12.2 172.6 9.3 146.3 9.5 99 8.2 122.3 8.9 103 12.5 117.8 9.1 121.5 93 (a) Use the given data for the treatment group to determine if there…arrow_forward
- A deficiency of the trace element selenium in the diet can negatively impact growth, immunity, muscle and neuromuscular function, and fertility. The introduction of selenium supplements to dairy cows is justified when pastures have low selenium levels. Authors of a research paper supplied the following data on milk selenium concentration (mg/L) for a sample of cows given a selenium supplement (the treatment group) and a control sample given no supplement, both initially and after a 9-day period. Initial Measurement Treatment Control 11.3 9.1 9.7 8.7 10.1 9.7 8.5 10.8 10.4 10.9 10.7 10.6 11.8 10.1 9.8 12.3 10.6 8.8 10.4 10.4 10.2 10.9 11.3 10.4 9.2 11.6 10.7 10.9 10.8 8.2 After 9 Days Treatment Control 138.3 9.4 104 8.8 96.4 8.8 89 10.1 88 9.7 103.8 8.7 147.3 10.3 97.1 12.3 172.6 9.4 146.3 9.5 99 8.3 122.3 8.9 103 12.5 117.8 9.1 121.5 93 (a) Use the given data for the treatment group to determine if…arrow_forwardA deficiency of the trace element selenium in the diet can negatively impact growth, immunity, muscle and neuromuscular function, and fertility. The introduction of selenium supplements to dairy cows is justified when pastures have low selenium levels. Authors of a research paper supplied the following data on milk selenium concentration (mg/L) for a sample of cows given a selenium supplement (the treatment group) and a control sample given no supplement, both initially and after a 9-day period. Initial Measurement Treatment Control 11.4 9.1 9.6 8.7 10.1 9.7 8.5 10.8 10.2 10.9 10.6 10.6 11.9 10.1 9.9 12.3 10.7 8.8 10.2 10.4 10.3 10.9 11.4 10.4 9.3 11.6 10.6 10.9 10.9 8.3 After 9 Days Treatment Control 138.3 9.2 104 8.9 96.4 8.9 89 10.1 88 9.6 103.8 8.6 147.3 10.4 97.1 12.4 172.6 9.2 146.3 9.5 99 8.4 122.3 8.8 103 12.5 117.8 9.1 121.5 93 (a) Use the given data for the treatment group to determine if…arrow_forward
arrow_back_ios
arrow_forward_ios
Recommended textbooks for you
 Glencoe Algebra 1, Student Edition, 9780079039897...AlgebraISBN:9780079039897Author:CarterPublisher:McGraw Hill
Glencoe Algebra 1, Student Edition, 9780079039897...
Algebra
ISBN:9780079039897
Author:Carter
Publisher:McGraw Hill
Hypothesis Testing - Solving Problems With Proportions; Author: The Organic Chemistry Tutor;https://www.youtube.com/watch?v=76VruarGn2Q;License: Standard YouTube License, CC-BY
Hypothesis Testing and Confidence Intervals (FRM Part 1 – Book 2 – Chapter 5); Author: Analystprep;https://www.youtube.com/watch?v=vth3yZIUlGQ;License: Standard YouTube License, CC-BY