
Introduction To Probability And Statistics
15th Edition
ISBN: 9781337554428
Author: Mendenhall, William.
Publisher: Cengage Learning,
expand_more
expand_more
format_list_bulleted
Concept explainers
Videos
Textbook Question
Chapter 1.3, Problem 5E
Stem and Leaf I Construct a stem and leaf plot for these 50 measurements and answer the questions in Exercises 3−5.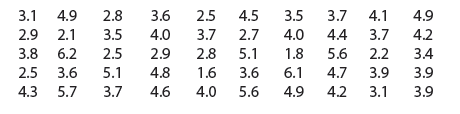
5. Find the eighth and ninth largest observations.
Expert Solution & Answer
Want to see the full answer?
Check out a sample textbook solution
Students have asked these similar questions
A) Make a stem and leaf plot of the data. B) how many of the measurements are greater than 40?
C) what percentage of the measurements are less than 25?
Ranking in a class graduation is what kind of measurement?
Given the information provided, need help stating the five-number summary of the measurements for the two data sets. Thank you :)
Chapter 1 Solutions
Introduction To Probability And Statistics
Ch. 1.1 - Experimental UnitsDefine the experimental units...Ch. 1.1 - Experimental UnitsDefine the experimental units...Ch. 1.1 - Experimental UnitsDefine the experimental units...Ch. 1.1 - Experimental UnitsDefine the experimental units...Ch. 1.1 - Experimental UnitsDefine the experimental units...Ch. 1.1 - Qualitative or Quantitative? Are the variables in...Ch. 1.1 - Qualitative or Quantitative? Are the variables in...Ch. 1.1 - Qualitative or Quantitative? Are the variables in...Ch. 1.1 - Qualitative or Quantitative? Are the variables in...Ch. 1.1 - Discrete or Continuous? Are the variables in...
Ch. 1.1 - Discrete or Continuous? Are the variables in...Ch. 1.1 - Discrete or Continuous? Are the variables in...Ch. 1.1 - Discrete or Continuous? Are the variables in...Ch. 1.1 - Discrete or Continuous? Are the variables in...Ch. 1.1 - Discrete or Continuous? Are the variables in...Ch. 1.1 - Discrete or Continuous? Are the variables in...Ch. 1.1 - Discrete or Continuous? Are the variables in...Ch. 1.1 - Discrete or Continuous? Are the variables in...Ch. 1.1 - Populations or Samples? In Exercises 1922,...Ch. 1.1 - Populations or Samples? In Exercises 1922,...Ch. 1.1 - Populations or Samples? In Exercises 1922,...Ch. 1.1 - Populations or Samples? In Exercises 1922,...Ch. 1.1 - Parking on Campus Six vehicles selected from a...Ch. 1.1 - Past U.S. Presidents A data set gives the ages at...Ch. 1.1 - Voter Attitudes You are a candidate for your state...Ch. 1.1 - Cancer Survival Times A researcher wants to...Ch. 1.1 - New Teaching Methods A researcher wants to know...Ch. 1.2 - Pie and Bar Charts The data in Exercises 13...Ch. 1.2 - Pie and Bar Charts The data in Exercises 13...Ch. 1.2 - Pie and Bar Charts The data in Exercises 13...Ch. 1.2 - Groups of People Fifty people are grouped into...Ch. 1.2 - Presidential Popularity After the elections of...Ch. 1.2 - Presidential Popularity After the elections of...Ch. 1.2 - Presidential Popularity After the elections of...Ch. 1.2 - Presidential Popularity After the elections of...Ch. 1.2 - Presidential Popularity After the elections of...Ch. 1.2 - Prob. 10ECh. 1.2 - Prob. 11ECh. 1.2 - Prob. 12ECh. 1.2 - Prob. 13ECh. 1.2 - Prob. 14ECh. 1.2 - Prob. 15ECh. 1.2 - Back to Work How long does it take you to adjust...Ch. 1.2 - Prob. 17ECh. 1.2 - Prob. 18ECh. 1.2 - Prob. 19ECh. 1.2 - Prob. 20ECh. 1.2 - Prob. 21ECh. 1.3 - DotplotsConstruct a dotplot for the data given in...Ch. 1.3 - DotplotsConstruct a dotplot for the data given in...Ch. 1.3 - Stem and Leaf I Construct a stem and leaf plot for...Ch. 1.3 - Stem and Leaf I Construct a stem and leaf plot for...Ch. 1.3 - Stem and Leaf I Construct a stem and leaf plot for...Ch. 1.3 - Stem and Leaf II Use the following set of data...Ch. 1.3 - Stem and Leaf II Use the following set of data...Ch. 1.3 - Prob. 8ECh. 1.3 - Prob. 9ECh. 1.3 - Comparing Graphs A discrete variable can take on...Ch. 1.3 - Prob. 11ECh. 1.3 - Prob. 12ECh. 1.3 - Prob. 13ECh. 1.3 - Prob. 14ECh. 1.3 - Prob. 15ECh. 1.3 - Prob. 16ECh. 1.3 - Prob. 17ECh. 1.3 - Calcium Contents The calcium content (Ca)of a...Ch. 1.3 - Prob. 19ECh. 1.3 - Prob. 20ECh. 1.3 - Prob. 21ECh. 1.3 - Prob. 22ECh. 1.3 - Prob. 23ECh. 1.3 - Prob. 24ECh. 1.3 - American Presidents The following table lists the...Ch. 1.4 - Graphing Relative Frequency Histograms Construct a...Ch. 1.4 - Graphing Relative Frequency Histograms Construct a...Ch. 1.4 - Interpreting Relative Frequency Histograms Use the...Ch. 1.4 - Interpreting Relative Frequency Histograms Use the...Ch. 1.4 - Interpreting Relative Frequency Histograms Use the...Ch. 1.4 - Interpreting Relative Frequency Histograms Use the...Ch. 1.4 - Interpreting Relative Frequency Histograms Use the...Ch. 1.4 - Interpreting Relative Frequency Histograms Use the...Ch. 1.4 - Class Boundaries In Exercises 912, use the...Ch. 1.4 - Class Boundaries In Exercises 912, use the...Ch. 1.4 - Prob. 11ECh. 1.4 - Prob. 12ECh. 1.4 - Prob. 13ECh. 1.4 - Prob. 14ECh. 1.4 - Relative Frequency Histogram I Construct a...Ch. 1.4 - Prob. 16ECh. 1.4 - Prob. 17ECh. 1.4 - Prob. 18ECh. 1.4 - Prob. 19ECh. 1.4 - Prob. 20ECh. 1.4 - Prob. 21ECh. 1.4 - Prob. 22ECh. 1.4 - Prob. 23ECh. 1.4 - Prob. 24ECh. 1.4 - A Recurring Illness The length of time (in months)...Ch. 1.4 - Prob. 26ECh. 1.4 - Prob. 27ECh. 1.4 - Prob. 28ECh. 1.4 - Prob. 29ECh. 1.4 - Prob. 30ECh. 1.4 - Prob. 31ECh. 1.4 - Student Heights The self-reported heights of 105...Ch. 1.4 - Prob. 33ECh. 1 - Quantitative or Qualitative? Identify each...Ch. 1 - Symmetric or Skewed? Do you expect the...Ch. 1 - Continuous or Discrete? Identify each variable as...Ch. 1 - Continuous or Discrete, again Identify each...Ch. 1 - World Lakes A lake is a body of water surrounded...Ch. 1 - Prob. 6RWYLCh. 1 - Election Results The 2016 election was a race in...Ch. 1 - Prob. 8RWYLCh. 1 - Prob. 9RWYLCh. 1 - Pulse Rates A group of 50 biomedical students...Ch. 1 - Prob. 11RWYLCh. 1 - Prob. 12RWYLCh. 1 - Gasoline Tax The following are the 2017 state...Ch. 1 - Prob. 14RWYLCh. 1 - Prob. 15RWYLCh. 1 - Prob. 16RWYLCh. 1 - Kentucky Derby The following data set shows the...Ch. 1 - Prob. 18RWYLCh. 1 - Old Faithful The following data are the waiting...Ch. 1 - Prob. 20RWYLCh. 1 - Prob. 1CSCh. 1 - Prob. 2CS
Knowledge Booster


Learn more about
Need a deep-dive on the concept behind this application? Look no further. Learn more about this topic, statistics and related others by exploring similar questions and additional content below.Similar questions
- Quarters. In Exercises 9-12, refer to the accompanying table of weights (grams) of quarters minted by the U.S. government. This table is available for download at www.TriolaStats.com Quarters: R Chart Treat the five measurements from each day as a sample and construct an R chart. What does the result suggest?arrow_forwardHow do I find the missing measurements?arrow_forward. The highway patrol is interested in determining the average speed of automobiles traveling on I-75 between Chattanooga and Atlanta. To accomplish this task, the speed of every tenth car passing a particular point on I-75 is recorded. a. What is the population for this study? b. What constitutes the sample? c. Is speed a categorical or a quantitative variable? d. What type of measurement scale is used?arrow_forward
- Find the first and third quartiles of these data. Use the chart to determine the answer.arrow_forwardA group of 50 biomedical students recorded their pulse rates by countingthe number of beats for 30 seconds and multiplying by 2. See Attachmenta. Why are all of the measurements even numbers?b. Draw a stem and leaf plot to describe the data, splitting each stem into two lines.c. Construct a relative frequency histogram for the data.d. Write a short paragraph describing the distribution of the student pulse rates.arrow_forward(a) Is the given data nominal, ordinal, interval, or ratio? Explain. The data above is ratio. Explainarrow_forward
- State whether the quantity described is a parameter or a statistic and give the correct notation.Average number of television sets per household in North Carolina, using data from a sample of 1100 households.arrow_forwardBased on the descriptions of the four levels of measurements, classify each of the variables listed below whether it is nominal, ordinal, interval, or ratio. Write your answer in the corresponding cell in the table that follows.arrow_forwardA doctor notes her patients temperature in degrees Fahrenheit every hour to make sure the peat isn’t does not get fever. What is the level of measurement of the data.arrow_forward
- 96. Which one of the following measurements is an example of qualitative data? the retail price of a car the mileage on a car the seating capacity of a car the model of a cararrow_forwardoints) Identify the type of scale of measurement for each of the following: Distance walked (in miles) on a treadmill. Placement in a beauty contest. Marital Status of patients in a physician’s office. Ratings of eight local plays (poor, fair, good, excellent). Rankings of tennisarrow_forward
arrow_back_ios
arrow_forward_ios
Recommended textbooks for you
 Glencoe Algebra 1, Student Edition, 9780079039897...AlgebraISBN:9780079039897Author:CarterPublisher:McGraw Hill
 Holt Mcdougal Larson Pre-algebra: Student Edition...AlgebraISBN:9780547587776Author:HOLT MCDOUGALPublisher:HOLT MCDOUGAL
 Big Ideas Math A Bridge To Success Algebra 1: Stu...AlgebraISBN:9781680331141Author:HOUGHTON MIFFLIN HARCOURTPublisher:Houghton Mifflin Harcourt
Glencoe Algebra 1, Student Edition, 9780079039897...
Algebra
ISBN:9780079039897
Author:Carter
Publisher:McGraw Hill
Holt Mcdougal Larson Pre-algebra: Student Edition...
Algebra
ISBN:9780547587776
Author:HOLT MCDOUGAL
Publisher:HOLT MCDOUGAL
Big Ideas Math A Bridge To Success Algebra 1: Stu...
Algebra
ISBN:9781680331141
Author:HOUGHTON MIFFLIN HARCOURT
Publisher:Houghton Mifflin Harcourt
Which is the best chart: Selecting among 14 types of charts Part II; Author: 365 Data Science;https://www.youtube.com/watch?v=qGaIB-bRn-A;License: Standard YouTube License, CC-BY