
Videos
a.
To find:The value of
a.
Answer to Problem 16E
The value of
Explanation of Solution
Given information: The data is shown below.
| x | 12 | 17 | 3 | 17 | 16 | 11 | 14 | 9 |
| y | 13 | 14 | 16 | 13 | 14 | 14 | 13 | 14 |
Calculation:
The MINITAB is shown below,
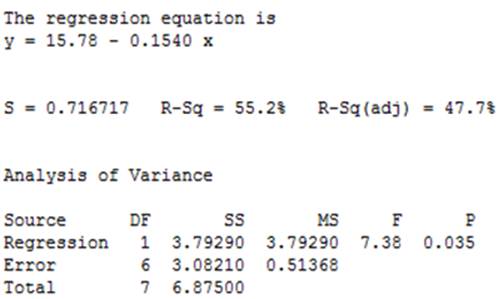
Figure-1
From Figure-1 it is clear that the value of
b.
To find: The value of
b.
Answer to Problem 16E
The value of
Explanation of Solution
Given information: The data is shown below.
| x | 12 | 17 | 3 | 17 | 16 | 11 | 14 | 9 |
| y | 13 | 14 | 16 | 13 | 14 | 14 | 13 | 14 |
Calculation:
From Figure-1 it is clear that the value of
c.
To find: The value of squares for
c.
Answer to Problem 16E
The value of squares for
Explanation of Solution
Given information: The data is shown below.
| x | 12 | 17 | 3 | 17 | 16 | 11 | 14 | 9 |
| y | 13 | 14 | 16 | 13 | 14 | 14 | 13 | 14 |
Calculation:
The table is shown below.
| 12 | -0.38 | 0.1444 |
| 17 | 4.62 | 21.3444 |
| 3 | -9.38 | 87.9844 |
| 17 | 4.62 | 21.3444 |
| 16 | 3.62 | 13.1044 |
| 11 | -1.38 | 1.9044 |
| 14 | 1.62 | 2.6244 |
| 9 | -3.38 | 11.4244 |
Thus, the value of squares for
d.
To find:The value of standard error of
d.
Answer to Problem 16E
The value of standard error of
Explanation of Solution
Given information: The data is shown below.
| x | 12 | 17 | 3 | 17 | 16 | 11 | 14 | 9 |
| y | 13 | 14 | 16 | 13 | 14 | 14 | 13 | 14 |
Calculation:
The value of
Thus, the value of standard error of
e.
To find:The critical value.
e.
Answer to Problem 16E
The critical value is
Explanation of Solution
Given information: The data is shown below.
| x | 12 | 17 | 3 | 17 | 16 | 11 | 14 | 9 |
| y | 13 | 14 | 16 | 13 | 14 | 14 | 13 | 14 |
Calculation:
The degree of freedom is,
The critical value is
f.
To find:The margin of error.
f.
Answer to Problem 16E
The margin of error is
Explanation of Solution
Given information: The data is shown below.
| x | 12 | 17 | 3 | 17 | 16 | 11 | 14 | 9 |
| y | 13 | 14 | 16 | 13 | 14 | 14 | 13 | 14 |
Calculation:
The margin of error is,
Thus, the margin of error is
g.
To find:The confidence interval for the data.
g.
Answer to Problem 16E
The confidence interval for the data is
Explanation of Solution
Given information: The data is shown below.
| x | 12 | 17 | 3 | 17 | 16 | 11 | 14 | 9 |
| y | 13 | 14 | 16 | 13 | 14 | 14 | 13 | 14 |
Calculation:
The confidence interval is,
Thus, the confidence interval for the data is
h.
To explain:The test for the hypothesis
h.
Explanation of Solution
Given information: The data is shown below.
| x | 12 | 17 | 3 | 17 | 16 | 11 | 14 | 9 |
| y | 13 | 14 | 16 | 13 | 14 | 14 | 13 | 14 |
Calculation:
The test statistics is,
Since, the test statistic is greater than the critical value.
Thus, the null hypothesis is rejected.
Want to see more full solutions like this?
Chapter 13 Solutions
ELEMENTARY STATISTICS(LL)(FD)


- Construct a 99% confidence interval for μ1−μ2 with the sample statistics for mean cholesterol content of a hamburger from two fast food chains and confidence interval construction formula below. Assume the populations are approximately normal with unequal variances. Stats x1=55 mg, s1=3.94 mg, n1=17arrow_forwardAssume that the population of serum amylase determinations from which the sample of size 15 (s = 33 ) is drawn is normally distributed. Construct a 98% confidence interval for the variance of the population.arrow_forwardSuppose that a researcher, using data on class size (CS) and average test scores from 100 third-grade classes, estimates the OLS regression TestScore = 494.3800 + (-5.5290) x CS. R = 0.10. SER = 10.9 (19.3800) (2.4089) Construct a 95% confidence interval for B,. the regression slope coefficient. The 95% confidence interval for B. the regression slope coefficient, is ( ). (Round your responses to two decimal places.) The t-statistic for the two-sided test of the null hypothesis Ho: B, = 0 is |. (Round your response to four decimal places.) Note: Assume a normal distribution. The p-value for the two-sided test of the null hypothesis H: B =0 is (Round your response to four decimal places) Do you reject the null hypothesis at the 1% level? O A. No, because the p-value is greater than 0.01. O B. Yes, because the t-statistic is greater than 2.58. OC. Yes, because the p-value is less than 0.01. O D. Yes, because the t-statistic is less than 2.58. The p-value for the two-sided test of the null…arrow_forward
- A random sample X₁, X₂, X3, X36 is given from a normal distribution with unknown mean µ = EX; and unknown variance Var(X;) = σ². For the observed sample, the sample mean is X = 35.8, and the sample variance is $² 12.5. a. Find and compare 90%, 95%, and 99% confidence interval for u. .../ -arrow_forwarda) Compute the least-squares line for predicting y from 1/x. Round the answers to three decimal places. b) Using the better fitting line, find a 95% confidence interval for the mean value of y when x = 5.0. Round the answers to three decimal places. The 95% confidence interval for the mean value of y when x = 5.0 is?arrow_forwardshow complete solutionarrow_forward
- In exercise 7, the data on y = annual sales ($1000s) for new customer accounts andx = number of years of experience for a sample of 10 salespersons provided the estimatedregression equation yˆ = 80 + 4x. For these data x = 7, o(xi − x)2 = 142, and s = 4.6098.a. Develop a 95% confidence interval for the mean annual sales for all salespersons withnine years of experience.b. The company is considering hiring Tom Smart, a salesperson with nine years of experience.Develop a 95% prediction interval of annual sales for Tom Smart.c. Discuss the differences in your answers to parts (a) and (b).arrow_forwardA least-squares regression line for a set of data with dependent variable y and independent variable x produces a 95% confidence interval [-0.5,1.8] on the regression slope (beta). We can conclude that: the predicted value of y for a given x will lie in the range [-0.5x,1.8x] 95% of the time the regression slope must be zero O beta will fall inside the range [-0.5,1.8] 95% of the time The data show no evidence of a linear relation between x and y O none of thesearrow_forwardConstruct a 90% confidence interval for μ1−μ2 with the sample statistics for mean calorie content of two bakeries' specialty pies and confidence interval construction formula below. Assume the populations are approximately normal with equal variances. Bakery A: x1 = 1890 calories, s1 = 134 and n1 = 8 Bakery B: x2 = 1712, s2 = 186 calories and n1 = 9 ------------------------------------------------------------------------- The confidence interval construction formula is in the attachment. Looking for __ <μ1 − μ2< __ (Round to the nearest integer as needed.)arrow_forward
 Glencoe Algebra 1, Student Edition, 9780079039897...AlgebraISBN:9780079039897Author:CarterPublisher:McGraw Hill