
Concept explainers
Videos
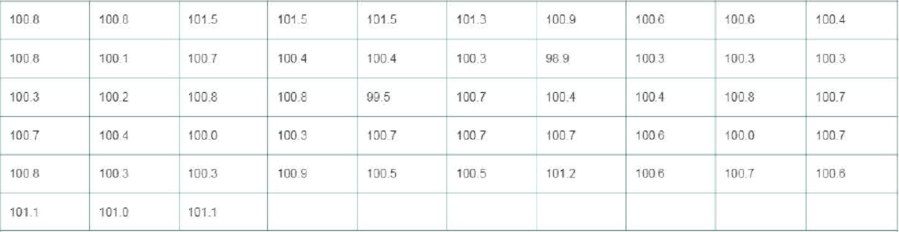
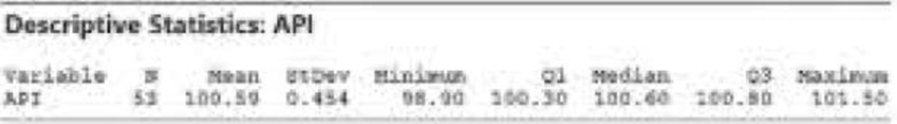
Active pharmaceutical ingredient. During the development of a new drug. pharmaceutical companies monitor the drug's active pharmaceutical ingredient (API). An article published in Organic Process Research & Development (July 2013) demonstrated the use of an individual control chart (x-chart) for this purpose. The data in the table represent API values for 53 consecutive batches of the new drug. (Note: Read across rows for consecutive API - measurements.) A Minitab printout with
- a. Locate the
mean and standard deviation of the sample data on the printout. - b. Use the mean and standard deviation to find the center line and the upper and lower control limits for an x-chart of the data, as in Example 13.3” (p. 13-15).
- c. Plot the data in an x-chart Is the process in control? No
Source: Based on K. Mukundam el al., “1-MR Control Chart: A Tool for Judging the Health of the Current Manufacturing Process of an API and for Setting the Trial Control Limits in Phase I of the Process Improvement.” Organic Procesa Research A Development. Vol. 17. July 2013 (Table 3).
Want to see the full answer?
Check out a sample textbook solution
Chapter 13 Solutions
Statistics for Business and Economics (13th Edition)


 Glencoe Algebra 1, Student Edition, 9780079039897...AlgebraISBN:9780079039897Author:CarterPublisher:McGraw Hill
 Big Ideas Math A Bridge To Success Algebra 1: Stu...AlgebraISBN:9781680331141Author:HOUGHTON MIFFLIN HARCOURTPublisher:Houghton Mifflin Harcourt
 Linear Algebra: A Modern IntroductionAlgebraISBN:9781285463247Author:David PoolePublisher:Cengage Learning
 Holt Mcdougal Larson Pre-algebra: Student Edition...AlgebraISBN:9780547587776Author:HOLT MCDOUGALPublisher:HOLT MCDOUGAL