Videos
1(a)
Financial Ratios: Financial ratios are the metrics used to evaluate the liquidity, capabilities, profitability, and overall performance of a company.
To determine: Return on total assets for five years (20Y4 to 20Y8)
Explanation of Solution
Return on assets determines the particular company’s overall earning power. It is determined by dividing sum of net income and interest expense and average total assets.
Formula:
1(b)
To determine: Return on
1(b)
Explanation of Solution
Formula:
1(c)
To determine: Times interest earned ratio for five years
1(c)
Explanation of Solution
Times interest earned ratio quantifies the number of times the earnings before interest and taxes can pay the interest expense. First, determine the sum of income before income tax and interest expense. Then, divide the sum by interest expense.
Formula:
1(d)
To determine: Ratio of liabilities to stockholders’ equity for five years (20Y4 to 20Y8)
1(d)
Explanation of Solution
Ratio of liabilities to stockholders’ equity is determined by dividing liabilities and stockholders’ equity. Liabilities are determined as the difference between ending balance of assets and stockholders’ equity.
Formula:
To Display: The determined ratios in a graph
Explanation of Solution
Return on total assets
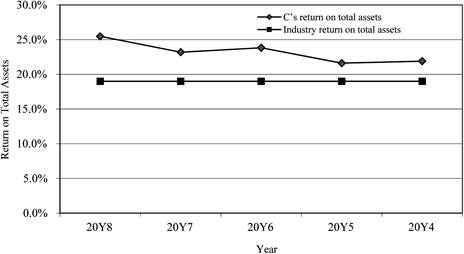
Figure (1)
Return on stockholders’ equity
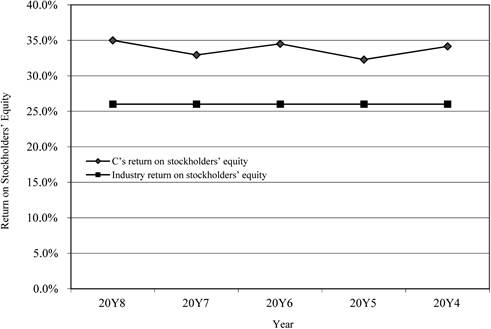
Figure (2)
Times interest earned ratio
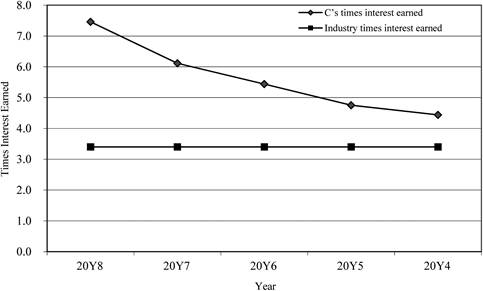
Figure (3)
Ratio of liabilities to stockholders’ equity
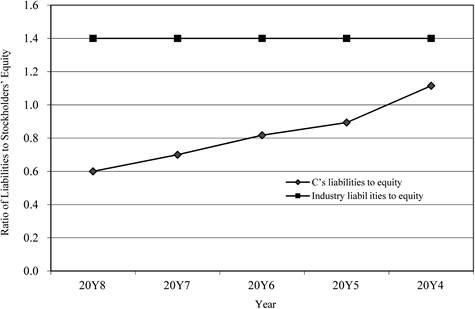
Figure (4)
2.
To prepare: Analysis of graphs
2.
Explanation of Solution
- The return on total assets and return on stockholders’ equity are in increasing trend for the last five years. There is a positive use of leverage. It is evident through the above ratios.
- The ratio of liabilities to stockholders’ equity shows that the proportion of debt to stockholders’ equity is declining over the period.
- The level of debt has been relative to the equity and has improved in the five years.
- The times interest earned ratio is improving
- g when compared to industry average.
Want to see more full solutions like this?
Chapter 14 Solutions
Financial & Managerial Accounting, Loose-Leaf Version


- Juroe Company provided the following income statement for last year: Juroes balance sheet as of December 31 last year showed total liabilities of 10,250,000, total equity of 6,150,000, and total assets of 16,400,000. Required: 1. Calculate the return on sales. (Note: Round the percent to two decimal places.) 2. CONCEPTUAL CONNECTION Briefly explain the meaning of the return on sales ratio, and comment on whether Juroes return on sales ratio appears appropriate.arrow_forwardFive measures of solvency or profitability The balance sheet for Garcon Inc. at the end of the current fiscal year indicated the following: Income before income tax was 3,000,000, and income taxes were 1,200,000 for the current year. Cash dividends paid on common stock during the current year totaled 1,200,000. The common stock was selling for 32 per share at the end of the year. Determine each of the following: (a) times interest earned ratio, (b) earnings per share on common stock, (c) price-earnings ratio, (d) dividends per share of common stock, and (e) dividend yield. Round ratios and percentages to one decimal place, except for per-share amounts.arrow_forwardCompute the following profitability measures for Esplanade Enterprises for 20-2: (a) Profit margin ratio (b) Return on assets (ROA) (c) Return on common stockholders equity (ROE) (d) Earnings per share of common stock (EPS)arrow_forward
- Financial leverage Costco Wholesale Corporation (COST) and Wel-Mart Stroes Inc. (WMT)reported the following data (in milllions) for a recent year: Compute the return on stockholders equity. Round to one decimal place.arrow_forwardAnalyze and compare Bank of America and Wells Fargo Bank of America Corporation (BAC) and Wells Fargo Company (WFC) are two large financial services companies. The following data (in millions) were taken from a recent years financial statements for both companies: a. Compute the earnings per share for both companies. Round to the nearest cent. a. Which company appears to be more profitable on an earnings-per-share basis? b. Which company would you expect to have the larger quoted market price?arrow_forward
 Managerial AccountingAccountingISBN:9781337912020Author:Carl Warren, Ph.d. Cma William B. TaylerPublisher:South-Western College Pub
 Managerial Accounting: The Cornerstone of Busines...AccountingISBN:9781337115773Author:Maryanne M. Mowen, Don R. Hansen, Dan L. HeitgerPublisher:Cengage Learning
 Financial Accounting: The Impact on Decision Make...AccountingISBN:9781305654174Author:Gary A. Porter, Curtis L. NortonPublisher:Cengage Learning
 Financial Reporting, Financial Statement Analysis...FinanceISBN:9781285190907Author:James M. Wahlen, Stephen P. Baginski, Mark BradshawPublisher:Cengage Learning