
Videos
You have been assigned to analyze the risk characteristics of these stocks. Prepare a report that includes but is not limited to the following items.
- a. Compute
descriptive statistics for each stock and the S&P 500. Comment on your results. Which stocks are the most volatile? - b. Compute the value of beta for each stock. Which of these stocks would you expect to perform best in an up market? Which would you expect to hold their value best in a down market?
- c. Comment on how much of the return for the individual stocks is explained by the market.
a.
Find the descriptive statistics for each stock and the S&P 500.
Comment on result and find the most volatile stock.
Answer to Problem 1CP
The descriptive statistics are obtained as given below:
The most volatile stock is for SanDisk Company.
Explanation of Solution
Calculation:
The data related to monthly return of stocks for eight companies with the market index S&P 500.
Descriptive Statistics:
Software procedure:
Step by step procedure to get descriptive statistics using MINITAB software is given below:
- Choose Stat > Basic Statistics > Display Descriptive Statistics.
- Under Variables, enter the columns ofMicrosoft, Exxon Mobil, Caterpillar, Johnson $ Johnson, McDonald’s, SanDisk, Qualcomm, Procter & Gamble and S&P 500.
- Click OK.
The output using MINITAB software is given as,
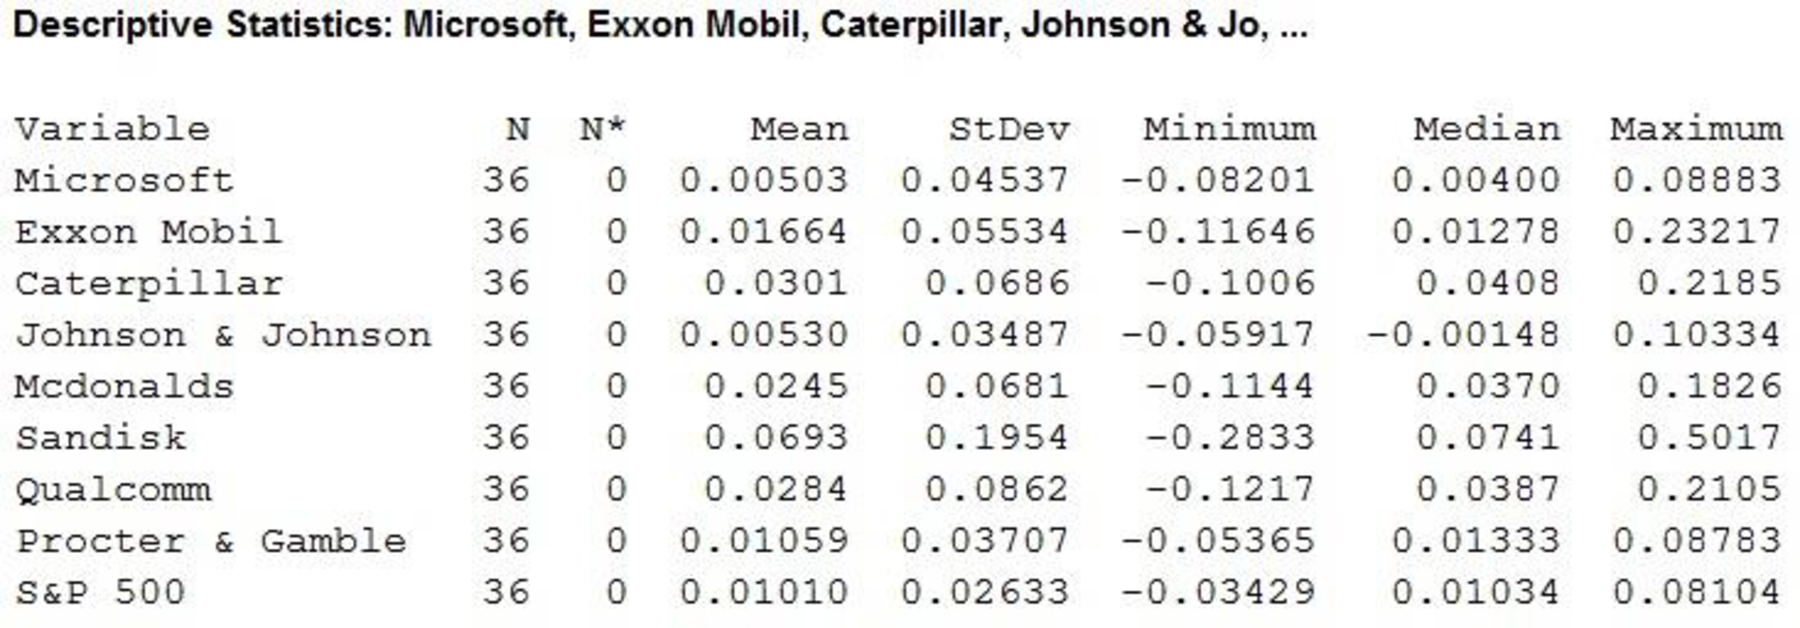
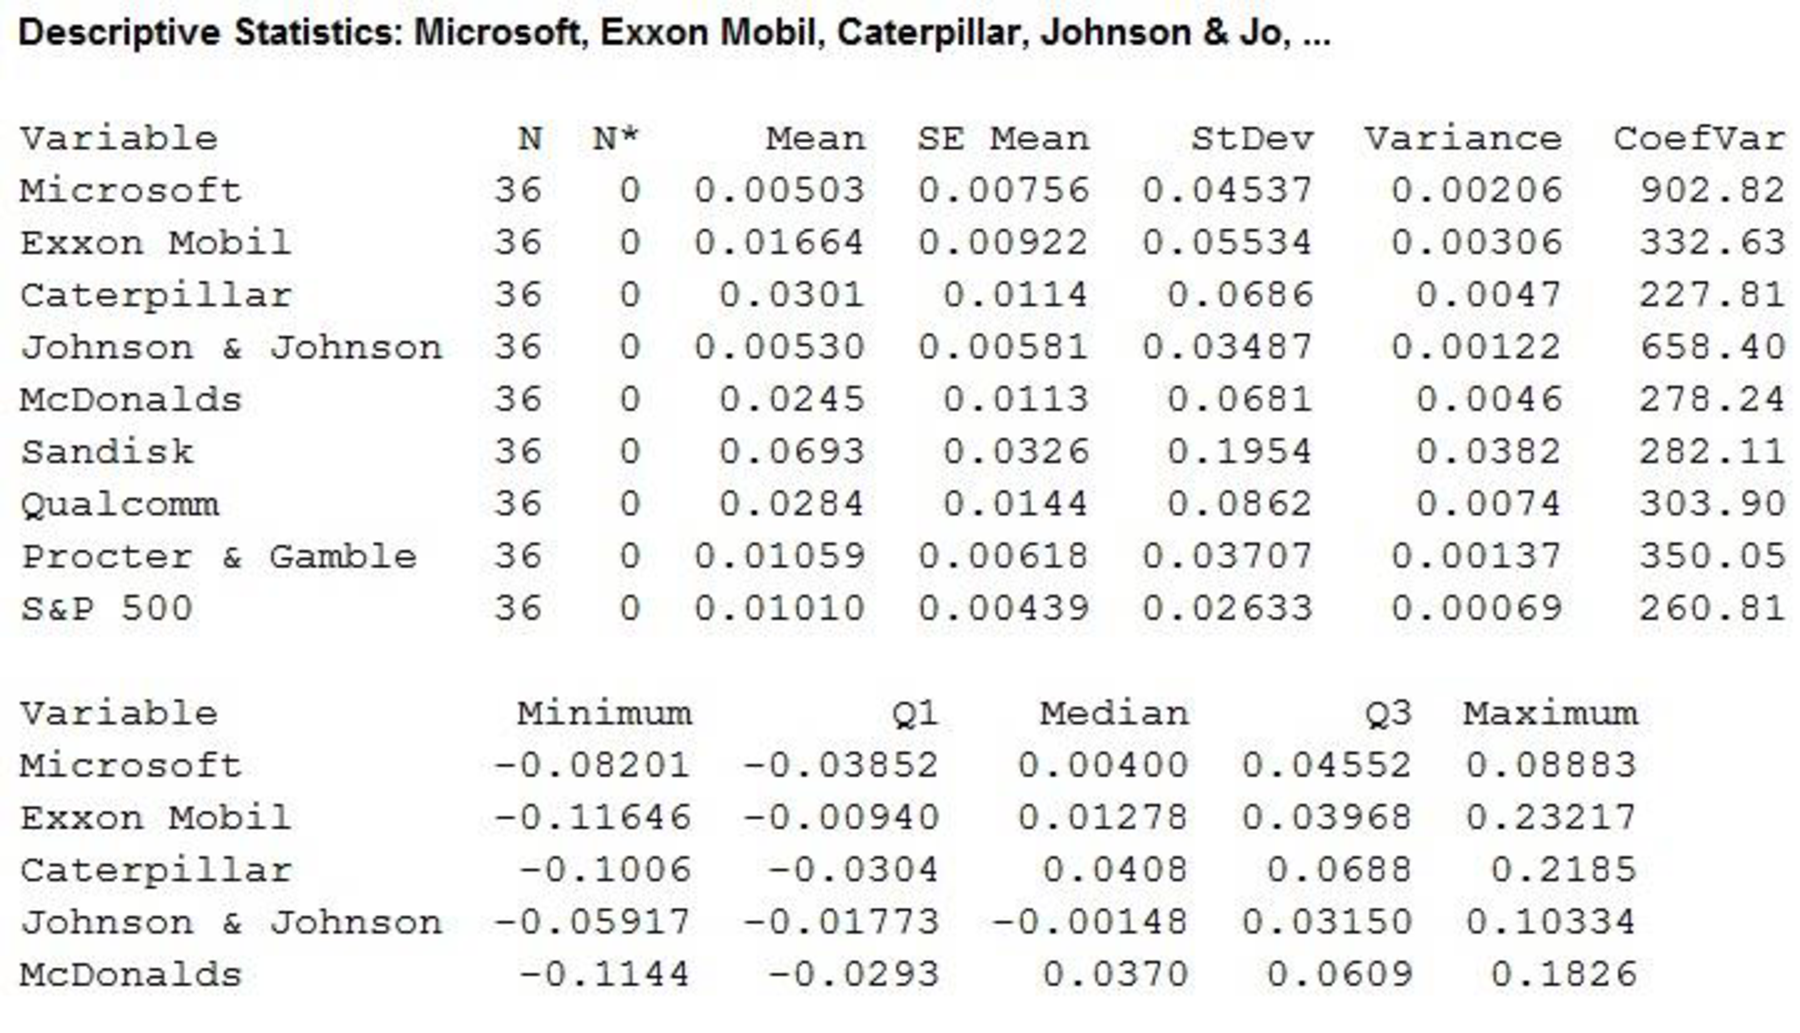
According to the output it is found that six companies, Exxon Mobil, Caterpillar, McDonald’s, SanDisk, Qualcomm and Procter & Gamblehad a higher mean monthly return than the S&P 500. Two companies Microsoft and Johnson & Johnson had the lower mean monthly returns.
Standard deviation can be treated as a measure of volatility for individual stock over several periods of time. The company SanDisk had the maximum standard deviation 0.1954. Thus, the volatility of SanDisk is high than other companies.
In addition, the stocks of Johnson & Johnson and Procter & Gamble had the standard deviation of 0.03487 and 0.03707, respectively. Thus, the volatility of Johnson & Johnson is lesser than other stocks.
However, the individual stocks are more volatile than the market as a whole.
b.
Find the values of beta for each stock.
Find the stocks that perform best in an up market.
Find the stocks that perform best in a down market.
Answer to Problem 1CP
The values of beta for each stock are given below:
| Company | Beta |
| Microsoft | 0.458 |
| Exxon Mobil | 0.731 |
| Caterpillar | 1.49 |
| Johnson & Johnson | 0.009 |
| McDonalds | 1.50 |
| SanDisk | 2.60 |
| Qualcomm | 1.41 |
| Procter & Gamble | 0.507 |
The stocks that perform best in an up market are Caterpillar, McDonalds, SanDisk and Qualcomm and the stocks that perform best in a down market are Microsoft, Exxon Mobil, Johnson & Johnson and Procter & Gamble.
Explanation of Solution
Calculation:
The value of beta for the stock market will always be 1.
If the betas are greater than 1 then that the stock is more volatile than the market and if betas are lesser than 1 indicated then the stock is less volatile than the market.
Regression:
Software procedure:
Step by step procedure to get regression equation using MINITAB software is given as,
- Choose Stat > Regression > Regression > Fit Regression Model.
- Under Responses, enter the column of Microsoft.
- Under Continuous predictors, enter the columns ofS&P 500.
- Click OK.
The output using MINITAB software is given as,
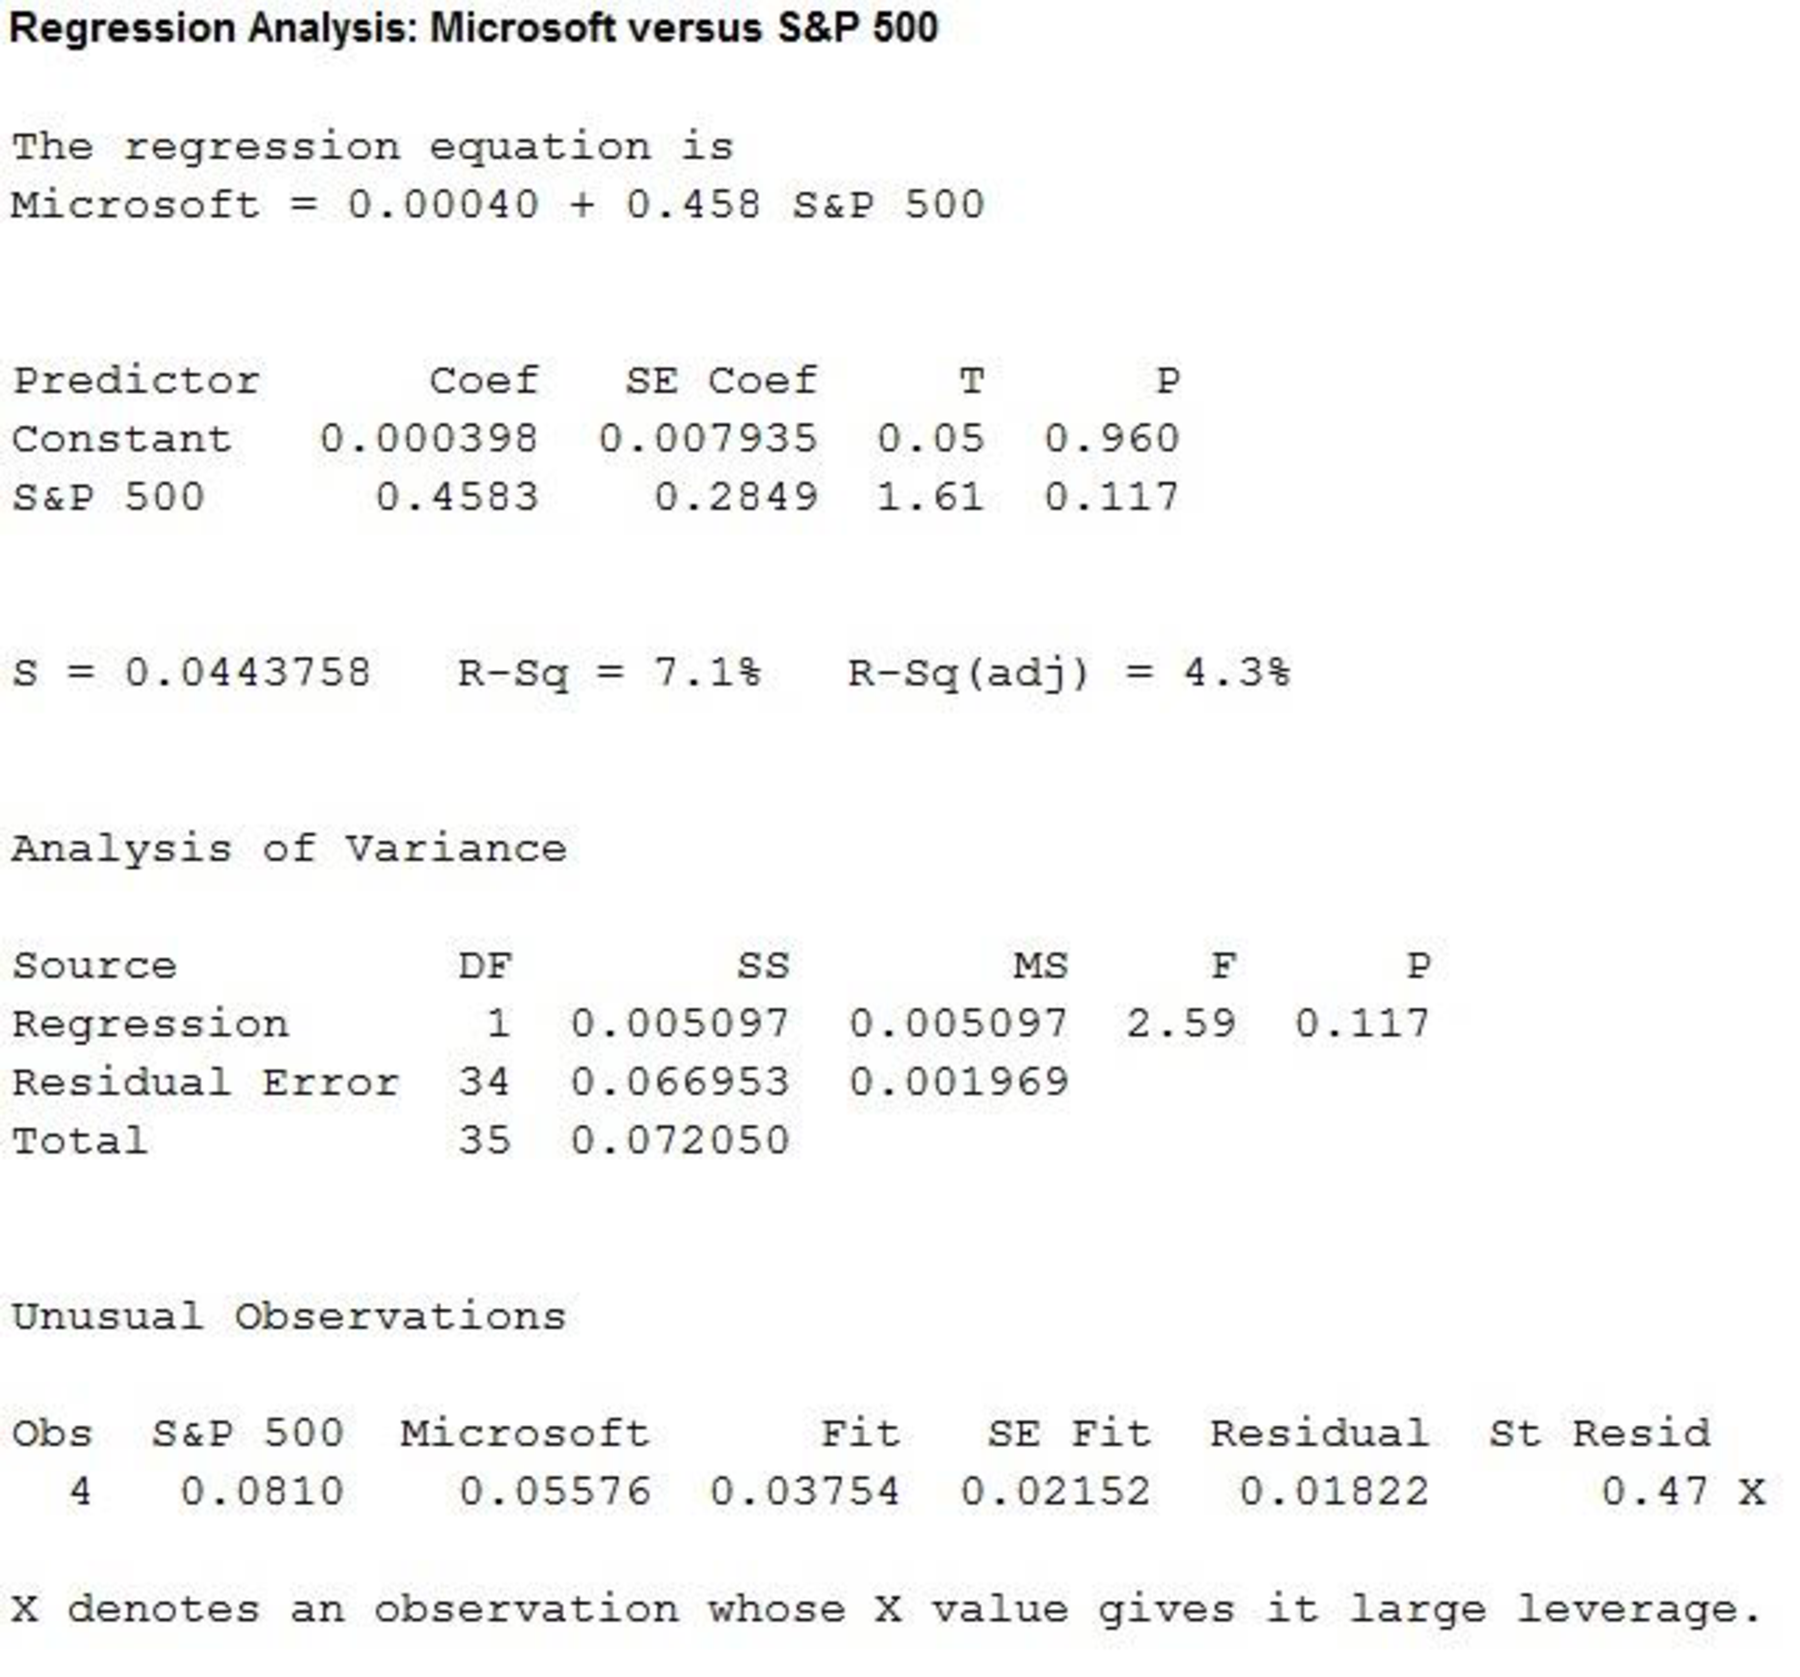
Thus, the estimated regression equation is
The slope of the regression equation is 0.458.
Regression:
Software procedure:
Step by step procedure to get regression equation using MINITAB software is given as,
- Choose Stat > Regression > Regression > Fit Regression Model.
- Under Responses, enter the column of Exxon Mobil.
- Under Continuous predictors, enter the columns ofS&P 500.
- Click OK.
The output using MINITAB software is given as,
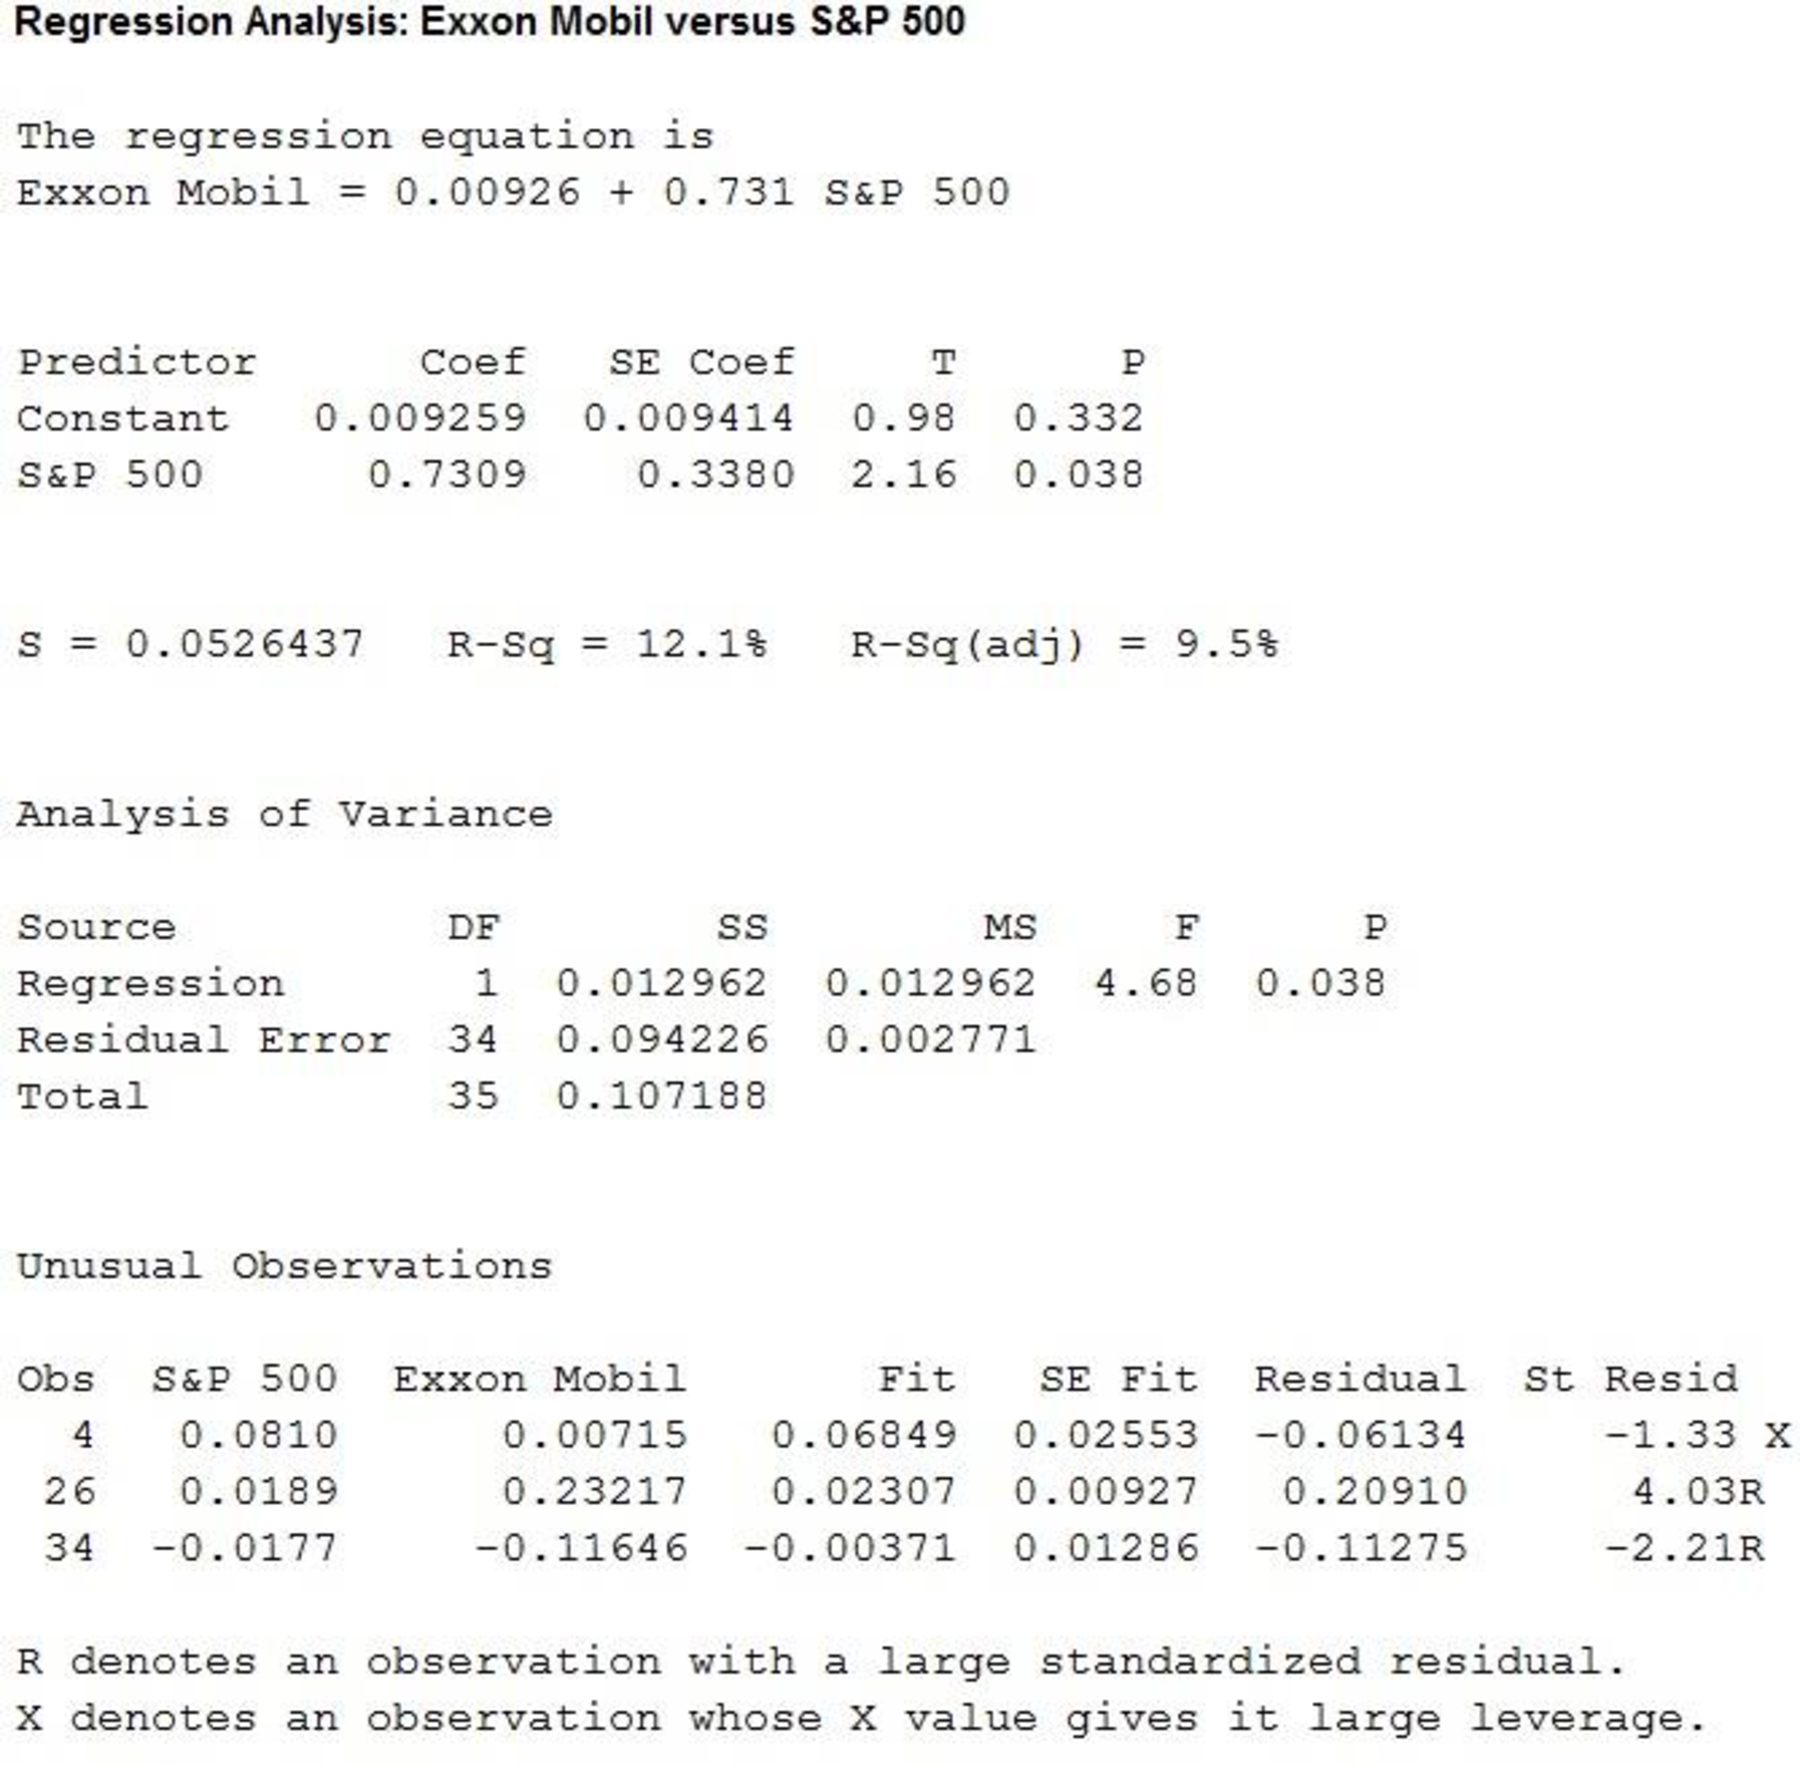
Thus, the estimated regression equation is
The slope of the regression equation is 0.731.
Regression:
Software procedure:
Step by step procedure to get regression equation using MINITAB software is given below:
- Choose Stat > Regression > Regression > Fit Regression Model.
- Under Responses, enter the column of Caterpillar.
- Under Continuous predictors, enter the columns of S&P 500.
- Click OK.
The output using MINITAB software is given as,
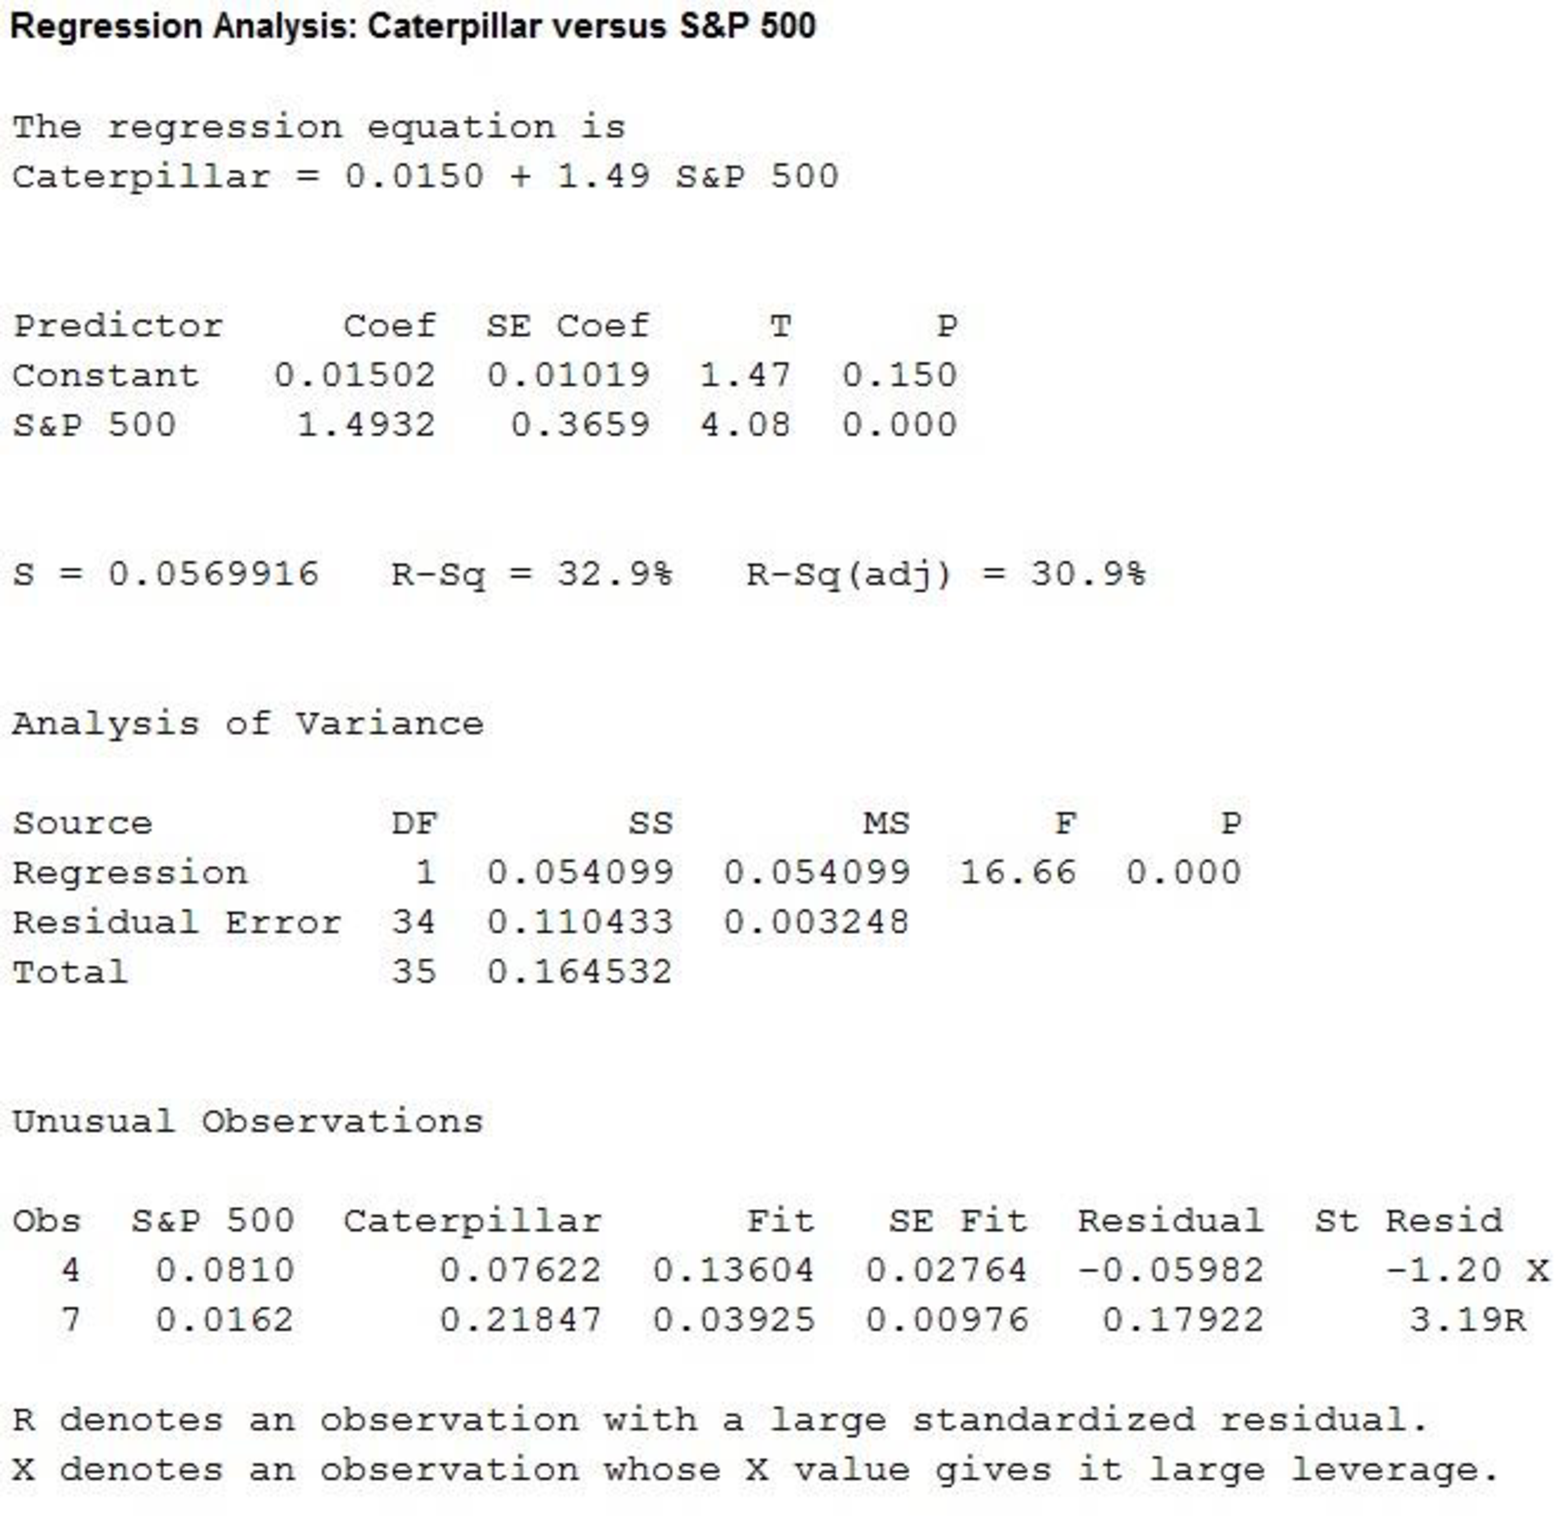
Thus, the estimated regression equation is
The slope of the regression equation is 1.49.
Regression:
Software procedure:
Step by step procedure to get regression equation using MINITAB software is given as,
- Choose Stat > Regression > Regression > Fit Regression Model.
- Under Responses, enter the column of Johnson & Johnson.
- Under Continuous predictors, enter the columns of S&P 500.
- Click OK.
The output using MINITAB software is given as,
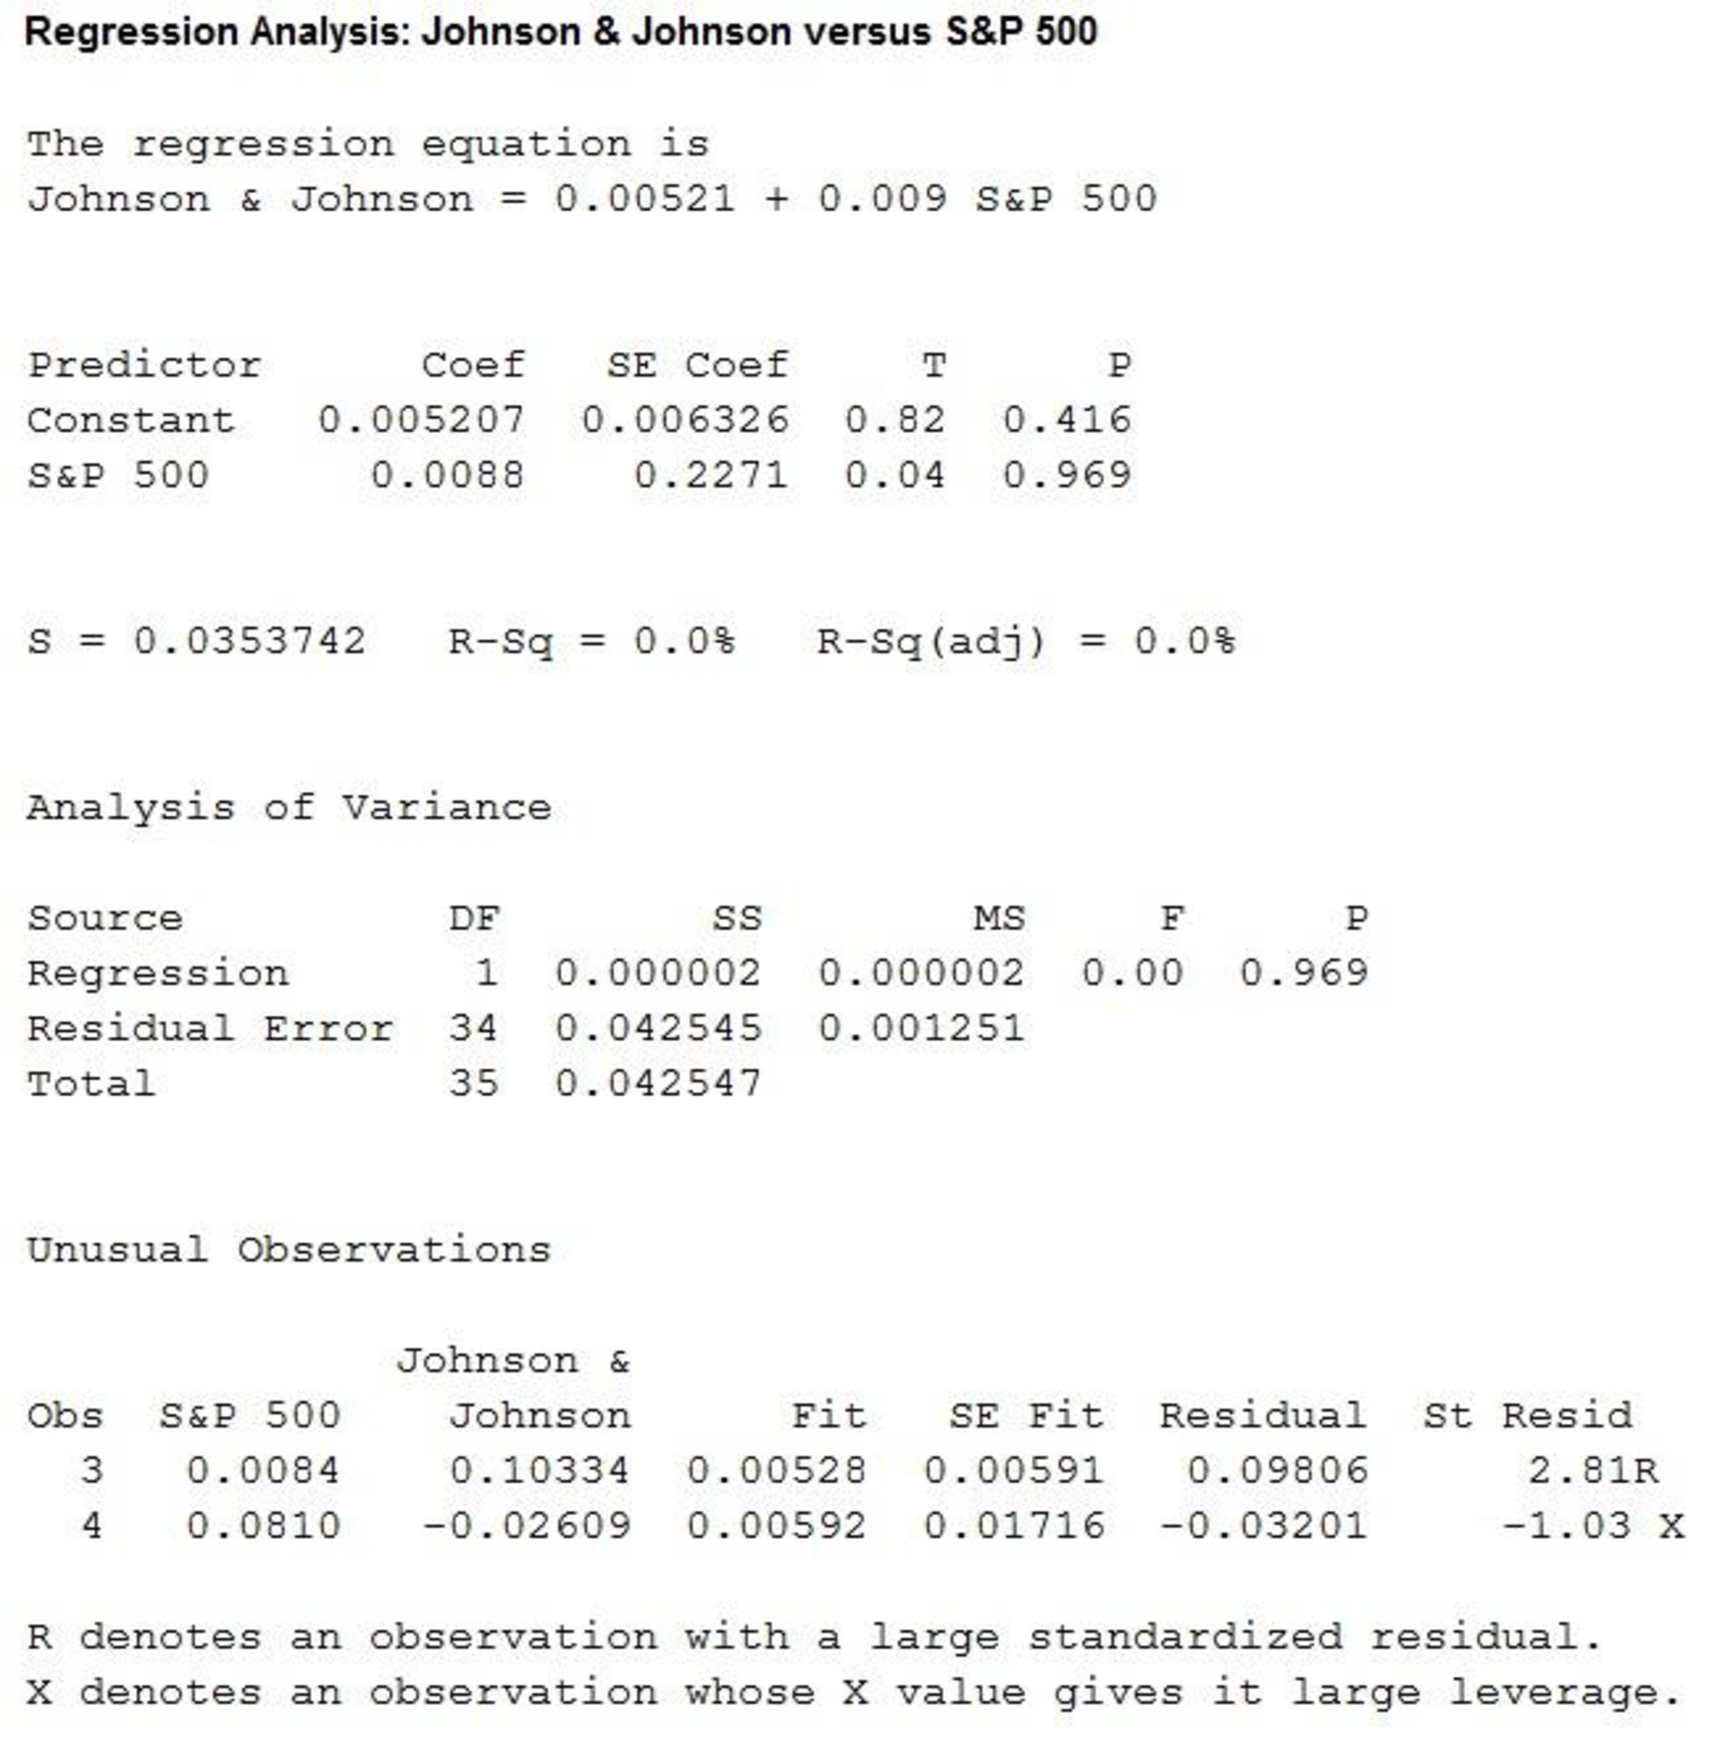
Thus, the estimated regression equation is
The slope of the regression equation is 0.009.
Regression:
Software procedure:
Step by step procedure to get regression equation using MINITAB software is given as,
- Choose Stat > Regression > Regression > Fit Regression Model.
- Under Responses, enter the column of McDonalds.
- Under Continuous predictors, enter the columns ofS&P 500.
- Click OK.
The output using MINITAB software is given as,
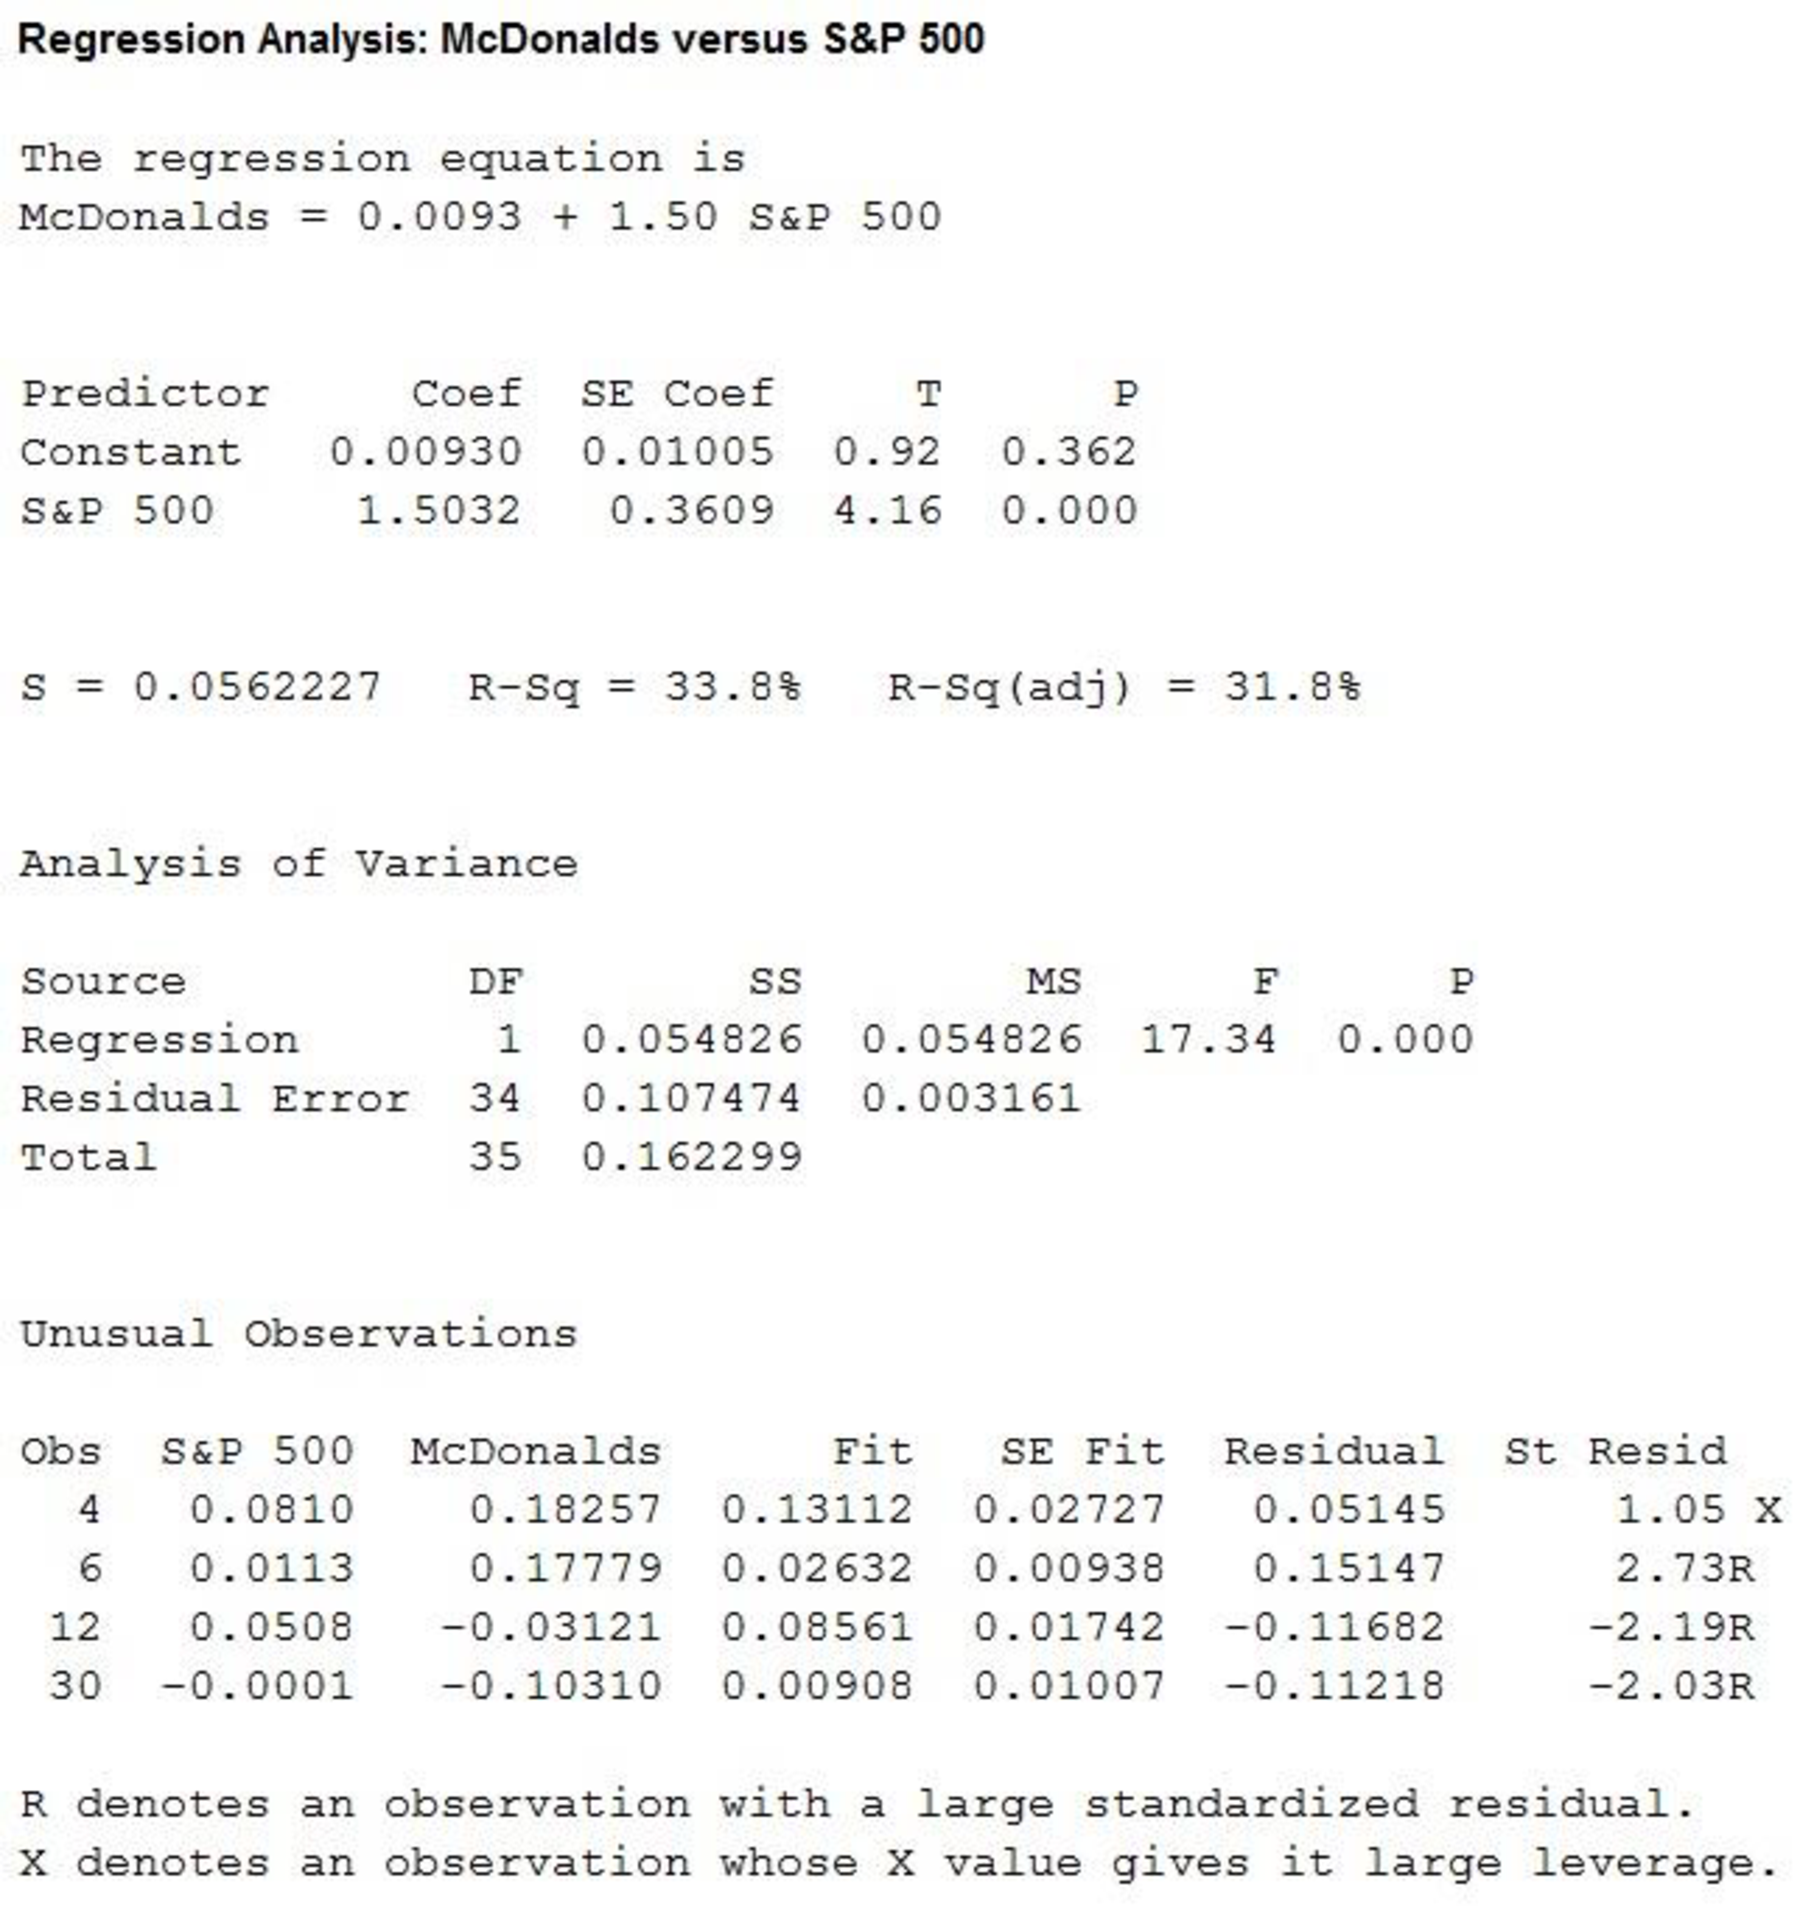
Thus, the estimated regression equation is
The slope of the regression equation is 1.50.
Regression:
Software procedure:
Step by step procedure to get regression equation using MINITAB software is given as,
- Choose Stat > Regression > Regression > Fit Regression Model.
- Under Responses, enter the column of SanDisk.
- Under Continuous predictors, enter the columns ofS&P 500.
- Click OK.
The output using MINITAB software is given as,
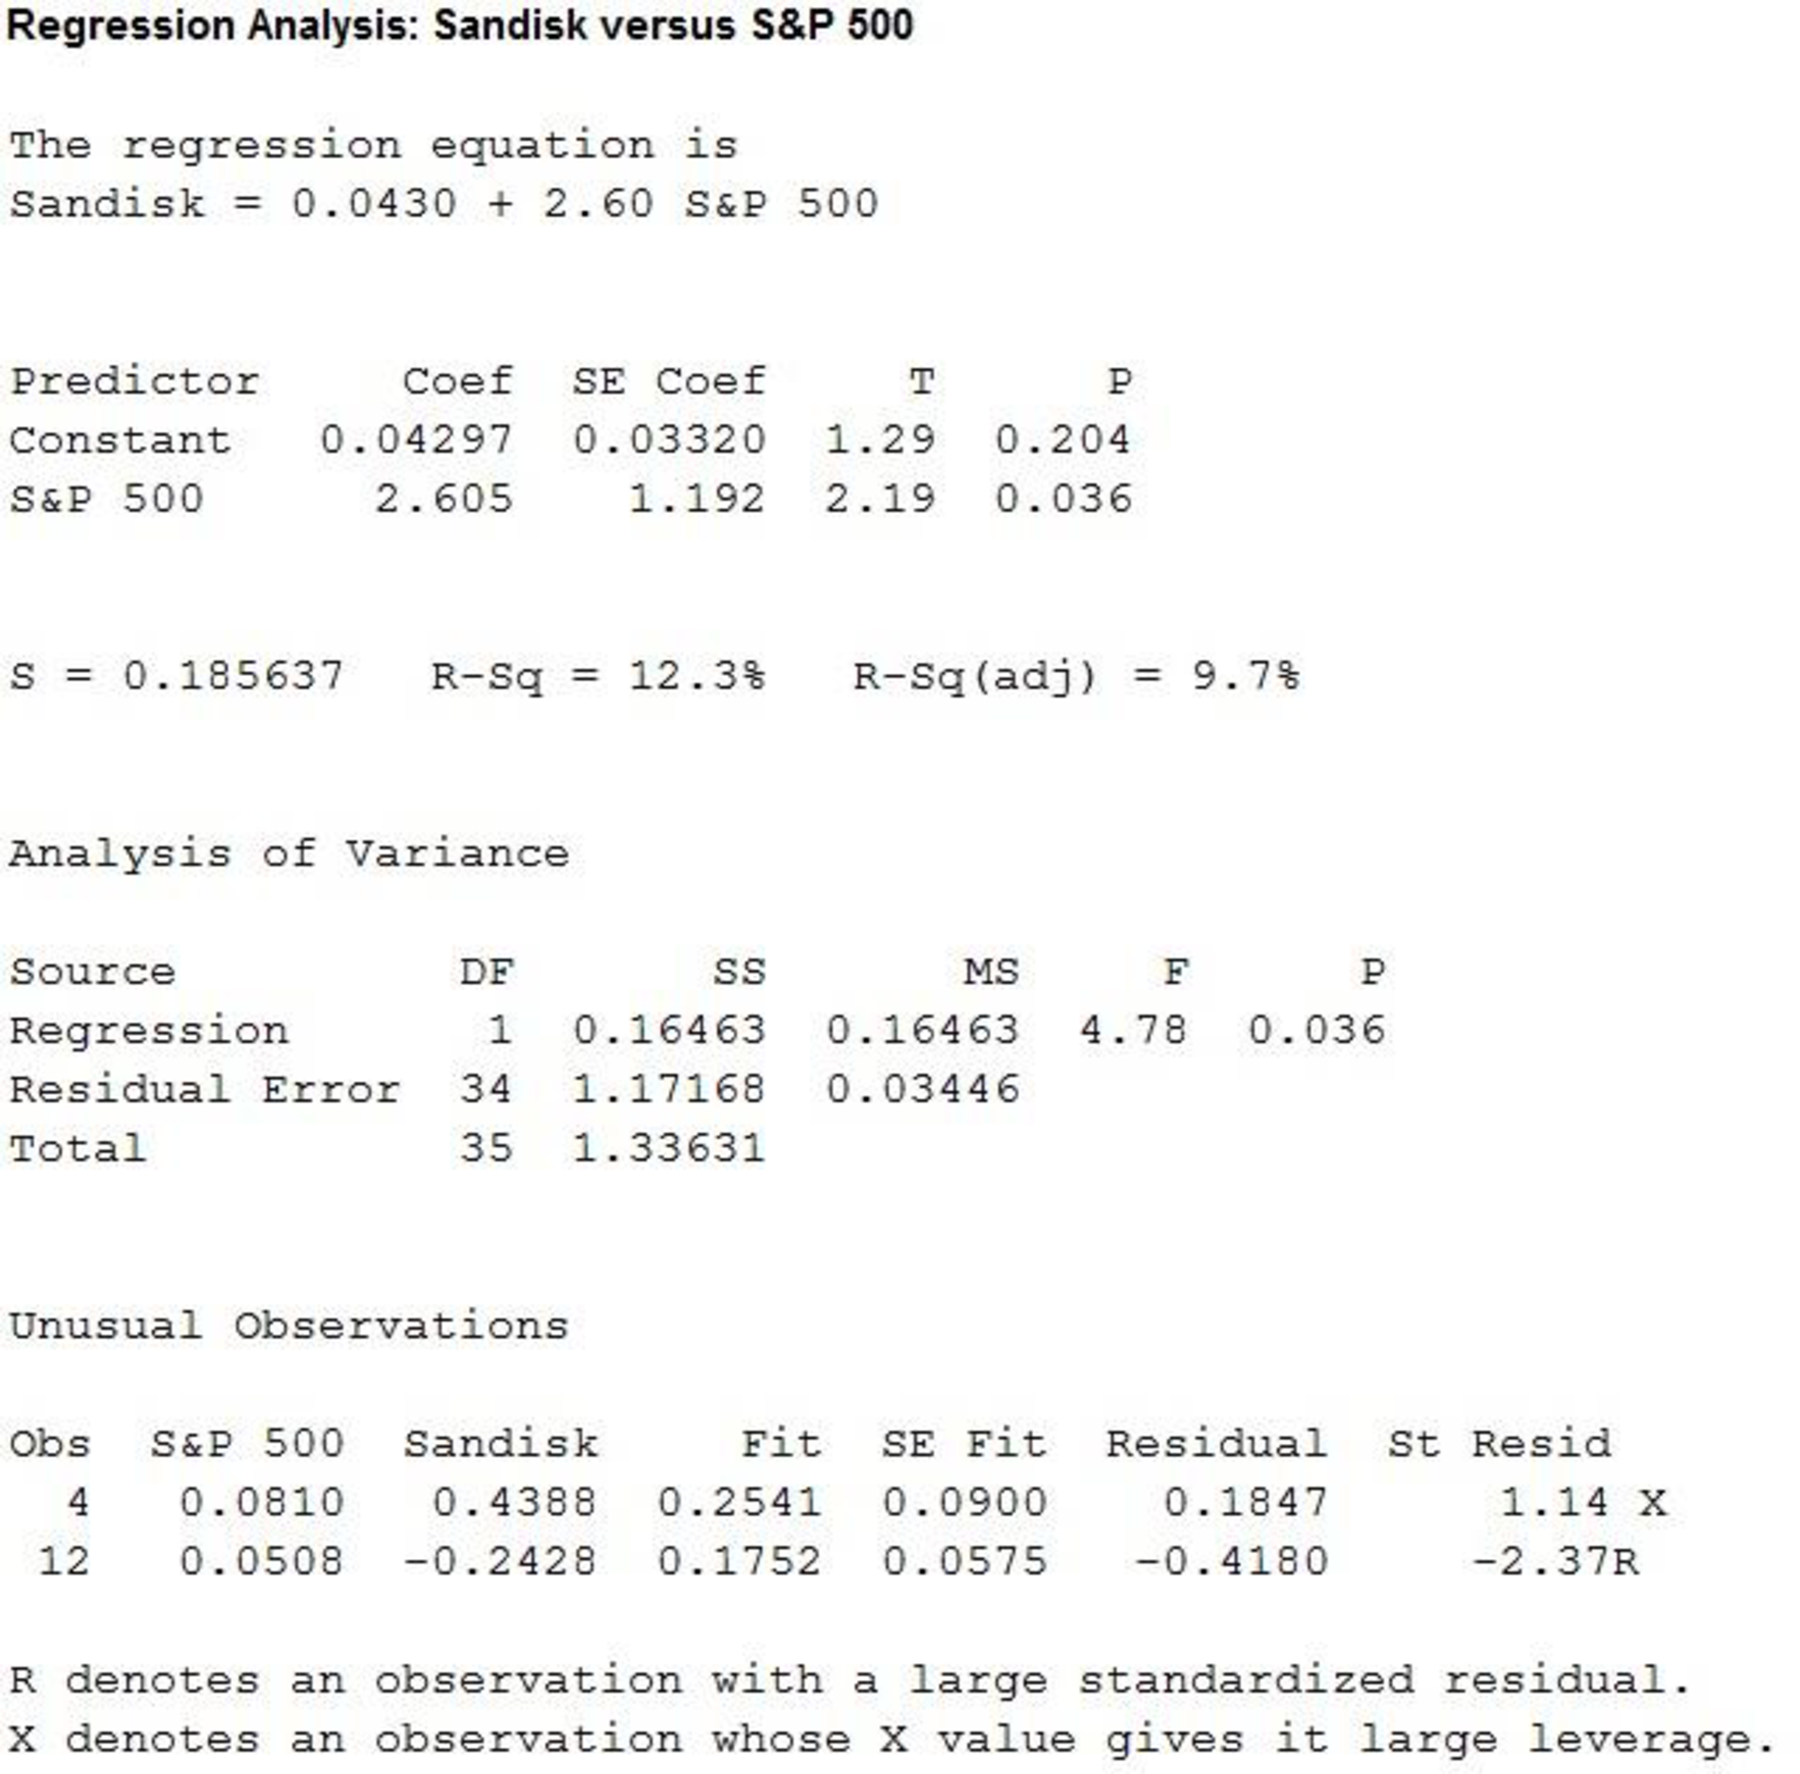
Thus, the estimated regression equation is
The slope of the regression equation is 2.60.
Regression:
Software procedure:
Step by step procedure to get regression equation using MINITAB software is given as,
- Choose Stat > Regression > Regression > Fit Regression Model.
- Under Responses, enter the column of Qualcomm.
- Under Continuous predictors, enter the columns ofS&P 500.
- Click OK.
The output using MINITAB software is given as,
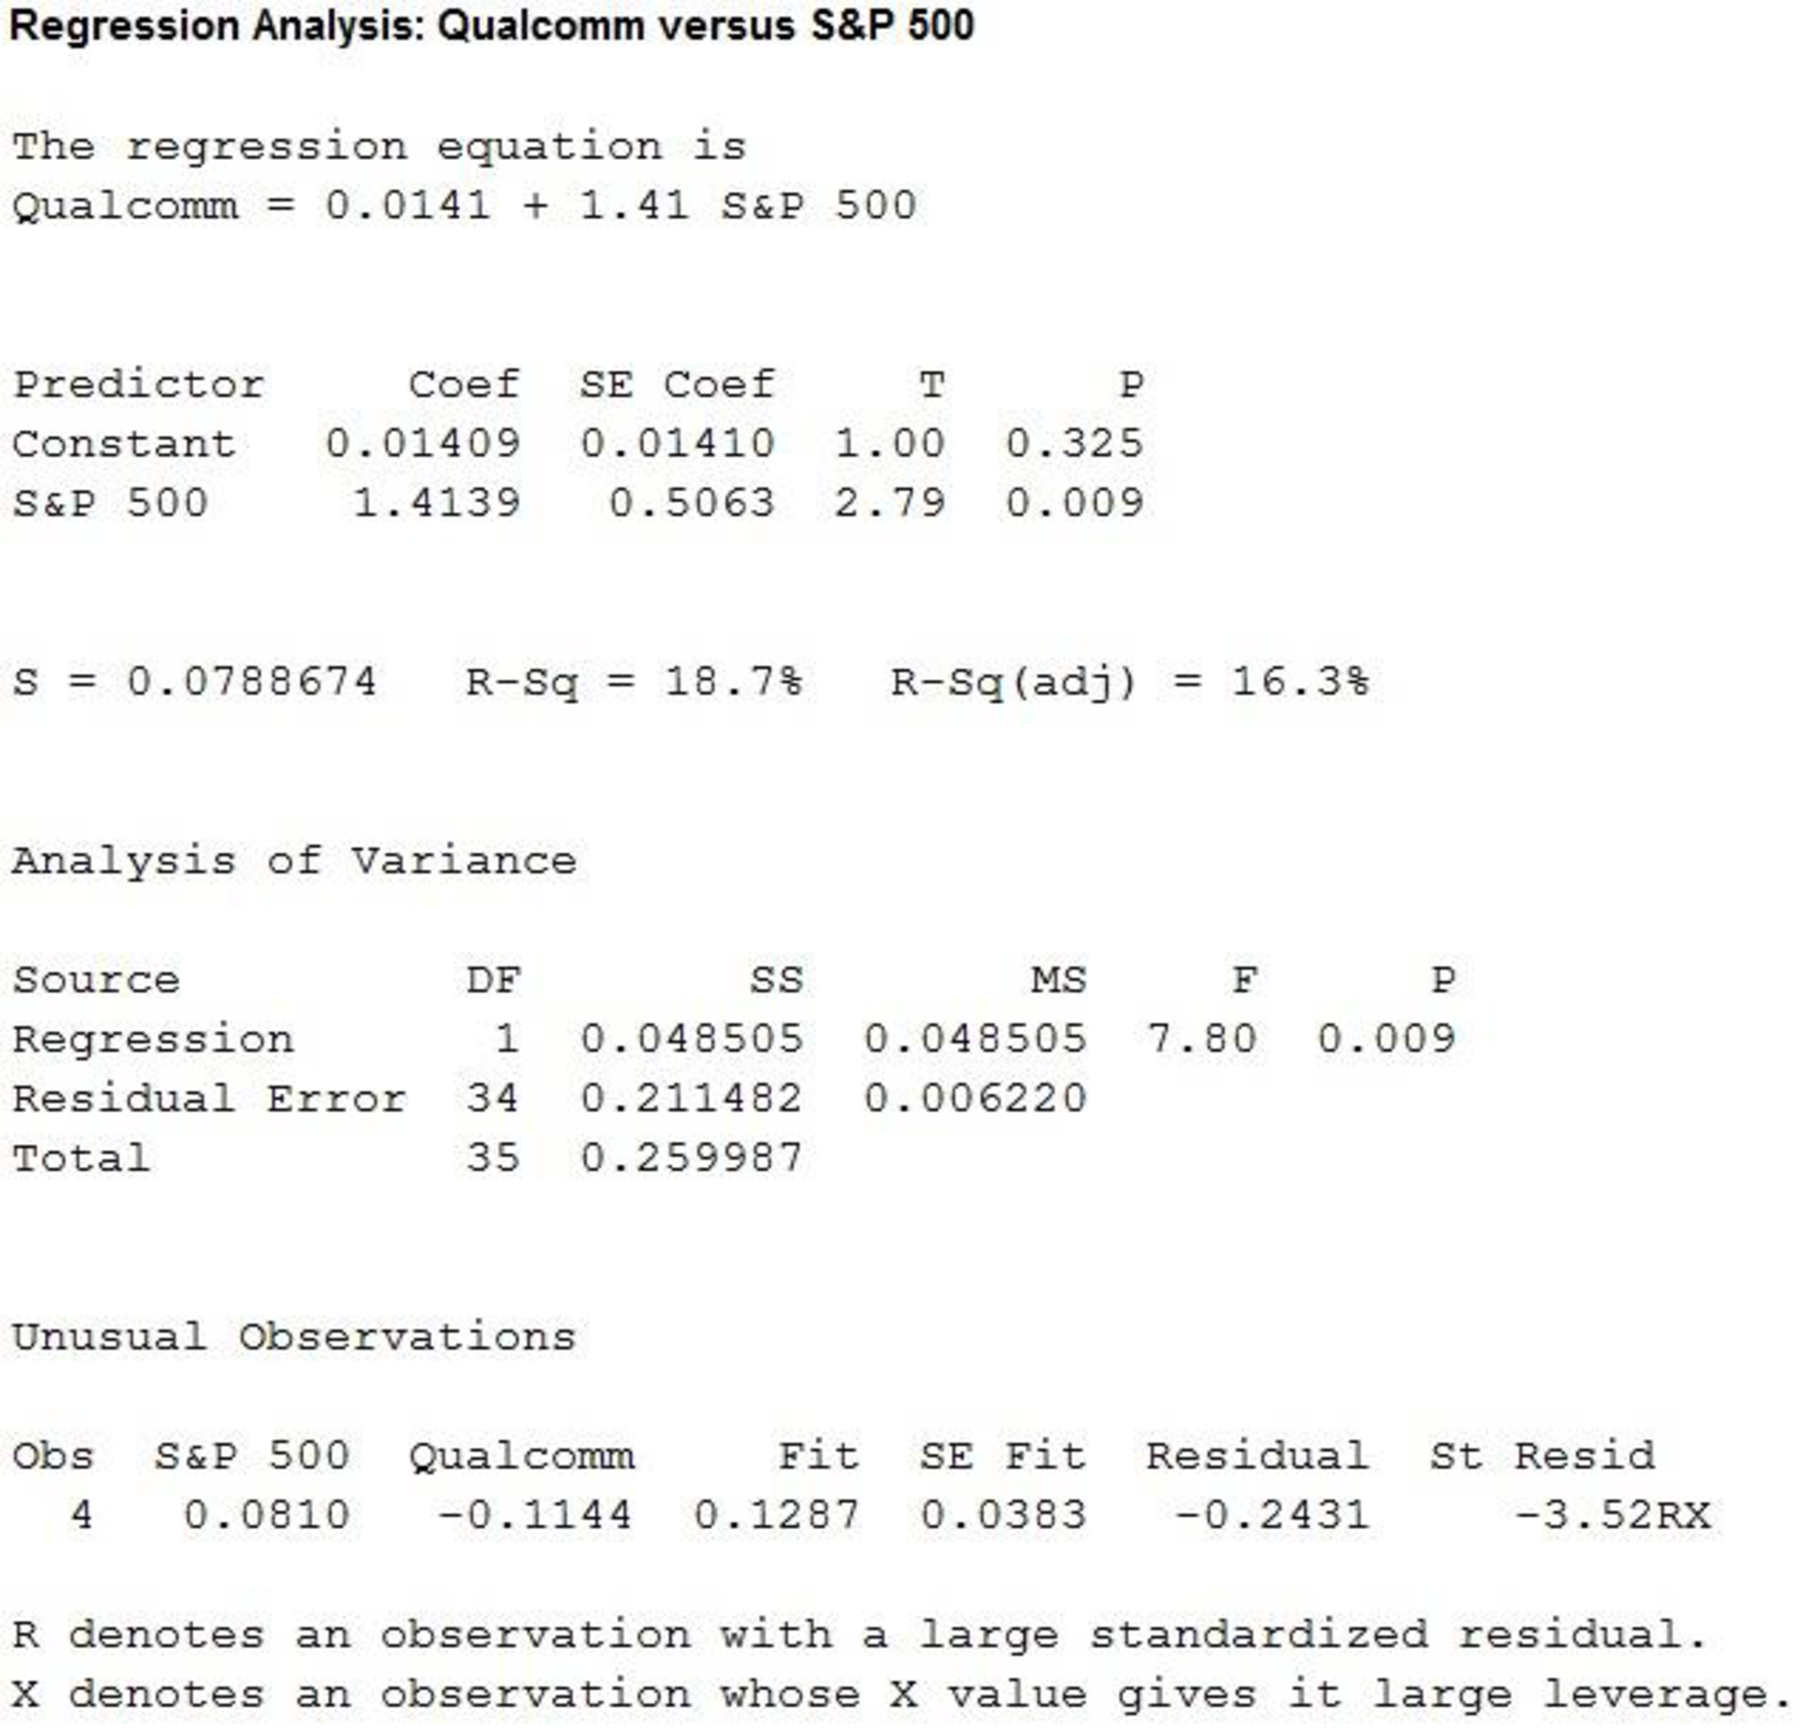
Thus, the estimated regression equation is
The slope of the regression equation is 1.41.
Regression:
Software procedure:
Step by step procedure to get regression equation using MINITAB software is given as,
- Choose Stat > Regression > Regression > Fit Regression Model.
- Under Responses, enter the column of Procter & Gamble.
- Under Continuous predictors, enter the columns ofS&P 500.
- Click OK.
The output using MINITAB software is given as,
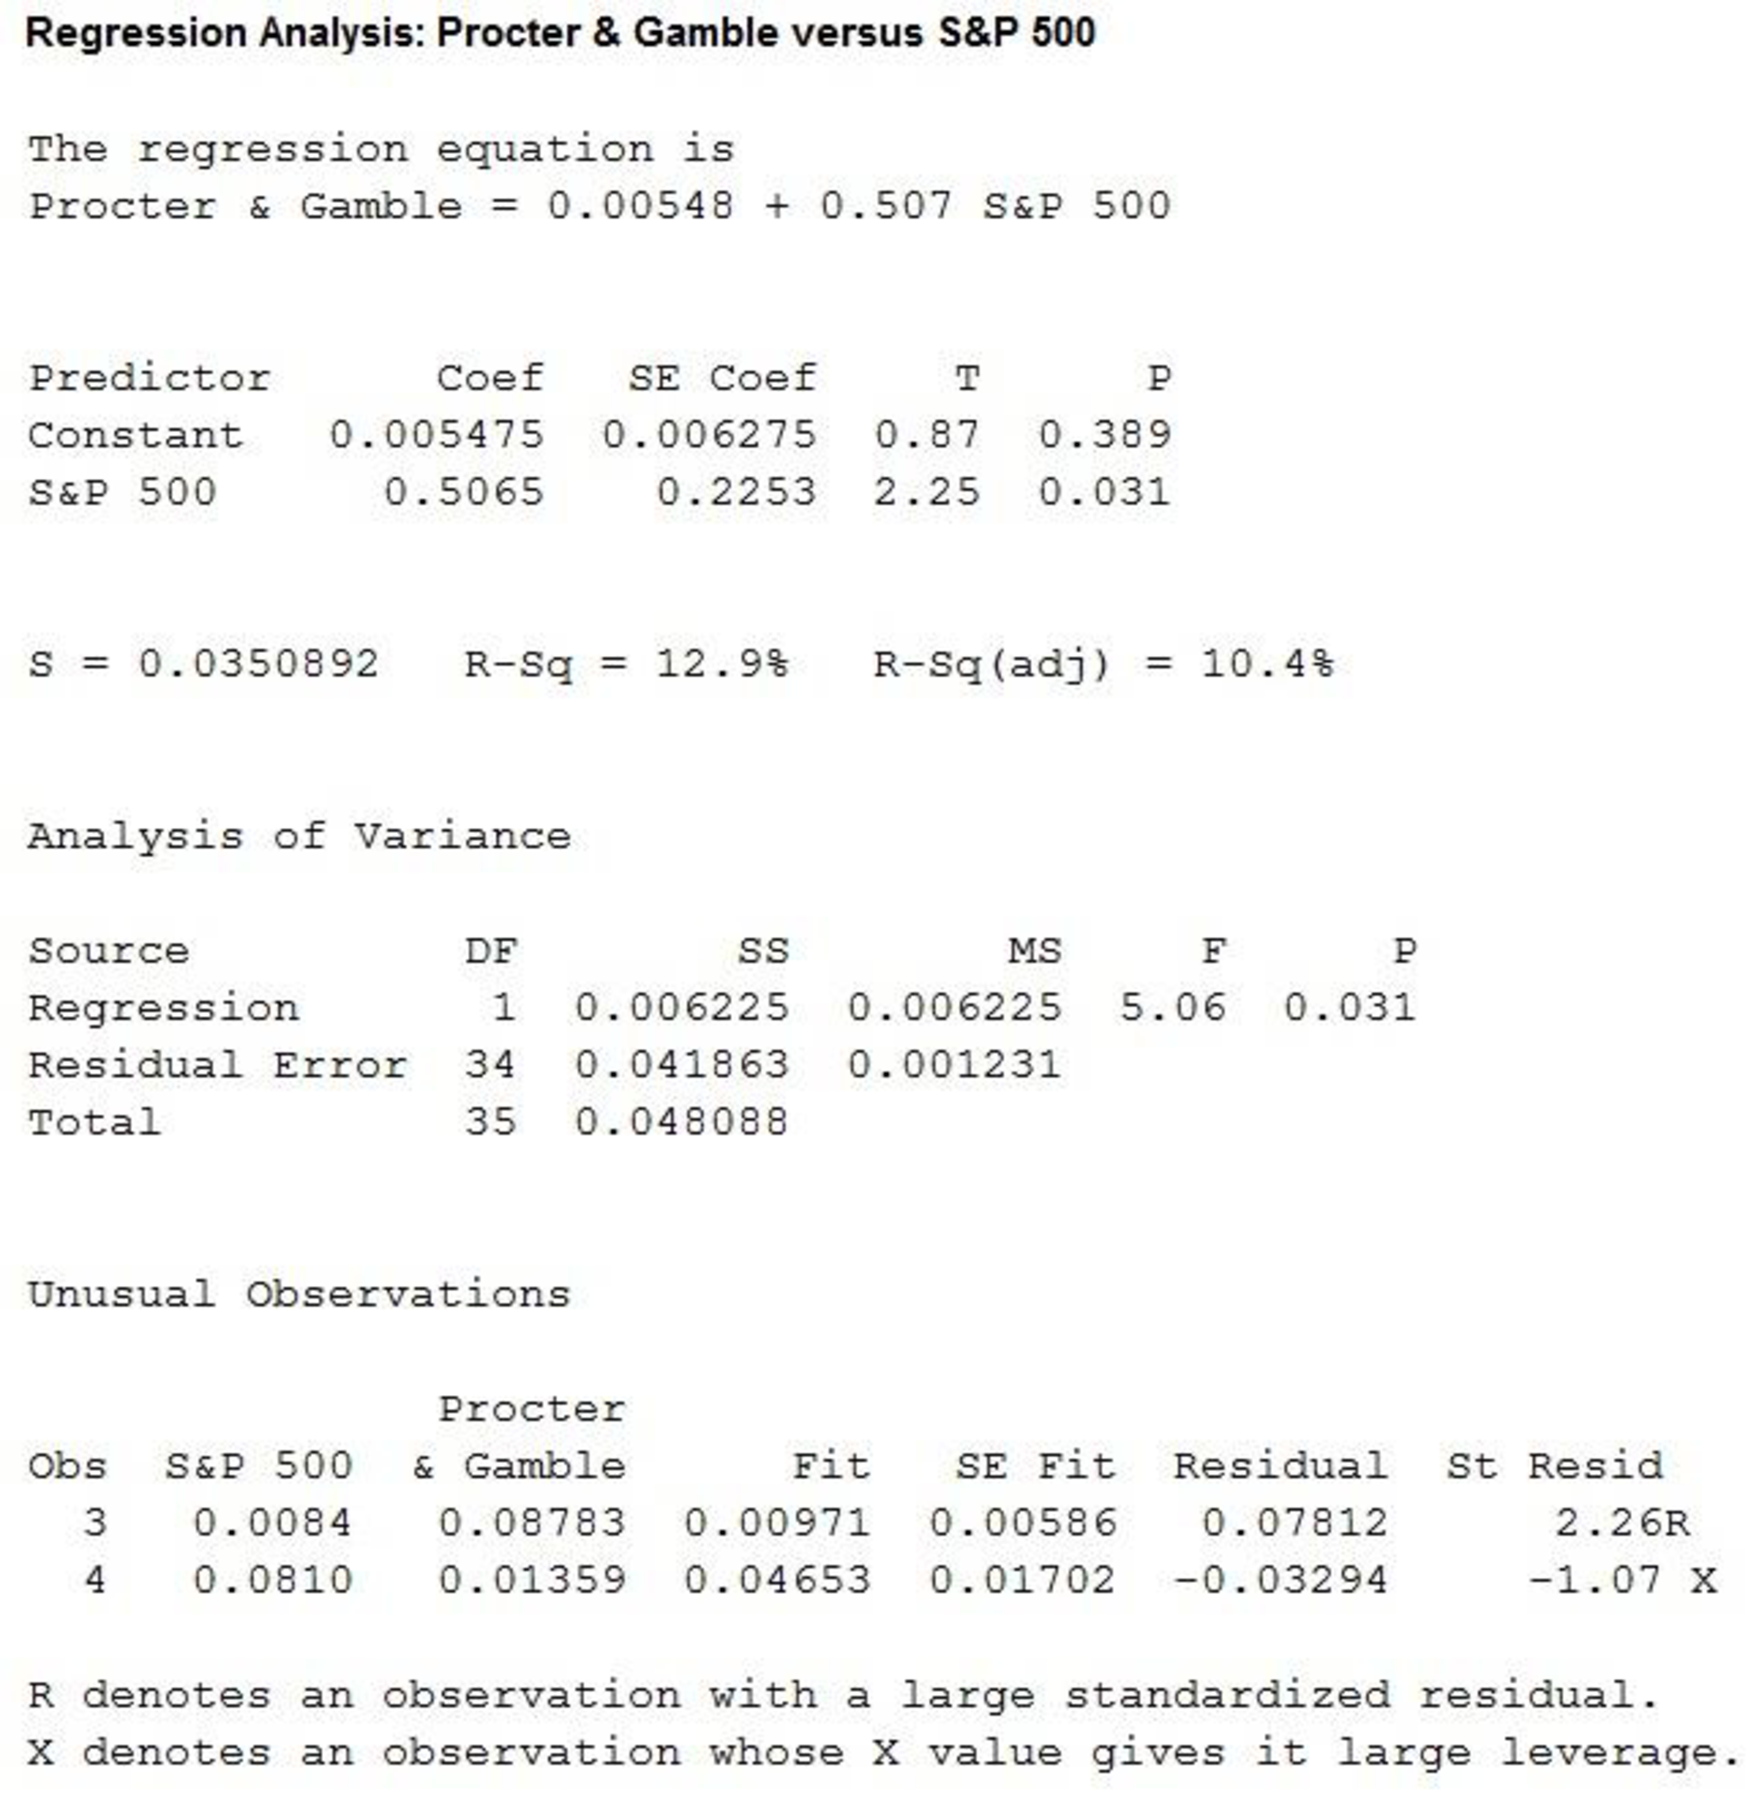
Hence, the estimated regression equation is
The slope of the regression equation is 0.507.
Thus, the values of beta for each stocks are,
| Company | Beta |
| Microsoft | 0.458 |
| Exxon Mobil | 0.731 |
| Caterpillar | 1.49 |
| Johnson & Johnson | 0.009 |
| McDonalds | 1.50 |
| SanDisk | 2.60 |
| Qualcomm | 1.41 |
| Procter & Gamble | 0.507 |
It is shown that the betas for Caterpillar, McDonalds, SanDisk and Qualcomm are greater than 1. Therefore these stocks are more volatile than the market.
Thus, the stocks that perform best in an up market are Caterpillar, McDonalds, SanDisk and Qualcomm.
It is shown that the betas for Microsoft, Exxon Mobil, Johnson & Johnson and Procter & Gamble are less than 1. Therefore these stocks are less volatile than the market.
Thus, the stocks that perform best in a down market are Microsoft, Exxon Mobil, Johnson & Johnson and Procter & Gamble.
c.
Comment on how much return for the individual stocks is explained by the market.
Explanation of Solution
Calculation:
The coefficient of determination (
Thus, the values of
| Company | |
| Microsoft | 7.1% |
| Exxon Mobil | 12.1% |
| Caterpillar | 32.9% |
| Johnson & Johnson | 0% |
| McDonalds | 33.8% |
| SanDisk | 12.3% |
| Qualcomm | 18.7% |
| Procter & Gamble | 12.9% |
Thus, the 7.1% variability in monthly return is explained by the variability of stock for Microsoft using the regression equation.
Thus, the 12.1% variability in monthly return is explained by the variability of stock for Exxon Mobil using the regression equation.
Thus, the 32.9% variability in monthly return is explained by the variability of stock for Caterpillar using the regression equation.
Thus, the 0.0% variability in monthly return is explained by the variability of stock for Johnson & Johnson using the regression equation.
Thus, the 33.8% variability in monthly return is explained by the variability of stock for McDonalds using the regression equation.
Thus, the 12.3% variability in monthly return is explained by the variability of stock for SanDisk using the regression equation.
Thus, the 18.7% variability in monthly return is explained by the variability of stock for Qualcomm using the regression equation.
Thus, the 12.9% variability in monthly return is explained by the variability of stock for Procter & Gamble using the regression equation.
Want to see more full solutions like this?
Chapter 14 Solutions
STATISTICS F/BUSINESS+ECONOMICS-TEXT


 Glencoe Algebra 1, Student Edition, 9780079039897...AlgebraISBN:9780079039897Author:CarterPublisher:McGraw Hill