EP STATISTICS F/THE BEHAV.SCI.-MINDTAP
10th Edition
ISBN: 9781305647312
Author: GRAVETTER
Publisher: CENGAGE L
bartleby

Videos

Textbook Question
Book Icon
Chapter 14, Problem 21P

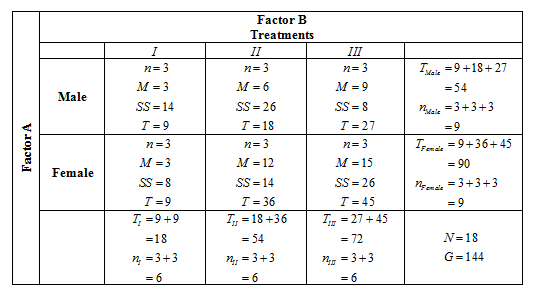
The following data are from a two-factor study examining the effects of three treatment conditions on males and females.

a. Use an ANOVA with α = .05 for all tests to evaluate the significance of the main effects and the interaction.

b. Test the simple main effects using α = .05 to eva1uate the mean difference between males and females for each of the three treatments.

    Treatment
    I II III
    1 7 9
    Male 2 2 11
    6 9 7
       T male = 54

       M = 3

       M = 6

       M = 9

       T = 9

       T = 18

       T = 27
    Factor A: Gender
       S S = 14

       S S = 26

       S S = 8

       N = 18
    3 10 16
       G = 144
    1 11 18
       X 2 = 16 0 8
    5 15 11
    Female
       M = 3

       M = 12

       M = 15

       T = 9

       T = 36

       T = 45

       T female = 9 0

       S S = 8

       S S = 14

       S S = 26

Expert Solution & Answer
Check Mark
To determine
  1. If the mean differences of the treatments are different.
  2. Test the simple main effects to evaluate the difference between males and females for each treatment.

Answer to Problem 21P

Solution:

  1. For these data, gender (Factor A) and treatment (Factor B) have significant effect. These data do not produce a significant interaction. This means, that the effect of treatment does not depend on the gender.
  2. There is a significant difference between males and females in treatments II and III but not in treatment I.

Explanation of Solution

Given Info:

EP STATISTICS F/THE BEHAV.SCI.-MINDTAP, Chapter 14, Problem 21P

Formula used:

The degrees of freedoms are:

d f Between =d f A +d f B +d f A×B d f A =I1 d f B =J1 d f A×B =( I1 )( J1 ) d f Within =NIJ d f Total =N1

The sums of squares are:

S S Total =S S A +S S B +S S A×B +S S Within S S Within = SS S S Between = T 2 n G 2 N S S A = T Rows 2 n Rows G 2 N S S B = T Columns 2 n Columns G 2 N S S A×B =S S Between S S A S S B

The MS values needed for the F-ratios are:

M S A = S S A d f A M S B = S S B d f B M S A×B = S S A×B d f A×B M S Within = S S Within d f Within

The F-ratios are:

F A = M S A M S Within F B = M S B M S Within F A×B = M S A×B M S Within

Calculation:

Part a:

For a two-factor study, there are three separate hypotheses, the two main effects and the interaction.

For Factor A, the null hypothesis states that there is no difference in the scores for male vs. female. In symbols,

H 0 : μ Male = μ Female

For Factor B, the null hypothesis states that there is no difference in the scores at different treatments. In symbols,

H 0 : μ I = μ II

For the A×B interaction, the null hypothesis states that factor A does not depend on the levels of factor B (and B does not depend on A).

H 0 :factor A does not depend on the levels of factor B ( and B does not depend on A )

The degrees of freedoms are:

d f A =I1=21=1 d f B =J1=31=2 d f A×B =( I1 )( J1 )=( 1 )( 2 )=2 d f Between =d f A +d f B +d f A×B =1+2+2=5 d f Within =NIJ=18( 2 )( 3 )=12 d f Total =N1=181=17

The sums of squares are:

S S Within = SS =14+26+8+8+14+26 =96 S S Between = T 2 n G 2 N =[ ( 9 ) 2 3 + ( 18 ) 2 3 + ( 27 ) 2 3 + ( 9 ) 2 3 + ( 36 ) 2 3 + ( 45 ) 2 3 ] 144 2 18 =15121152 =360 S S A = T Rows 2 n Rows G 2 N =[ 54 2 9 + 90 2 9 ] 144 2 18 =12241152 =72 S S B = T Columns 2 n Columns G 2 N =[ 18 2 6 + 54 2 6 + 72 2 6 ] 180 2 60 =14041152 =252 S S A×B =S S Between S S A S S B =36072252 =36 S S Total =S S Between +S S Within =360+96 =456

The MS values needed for the F-ratios are:

M S A = S S A d f A = 72 1 =72 M S B = S S B d f B = 252 2 =126 M S A×B = S S A×B d f A×B = 36 2 =18 M S Within = S S Within d f Within = 96 12 =8

The F-ratios are:

F A = M S A M S Within = 72 8 =9.00 F B = M S B M S Within = 126 8 =15.75 F A×B = M S A×B M S Within = 18 8 =2.25

The two factor ANOVA table is shown below:

Source SS df MS F
Between Treatments 360 5
Factor A 72 1 72 9.00
Factor B 252 2 126 15.75
A×B Interaction 36 2 18 2.25
Within Treatments 96 12 8
Total 456 17

From F table, at α=0.05 , the critical values are:

Fcritica l A = F .05,1,12 =4.75 Fcritica l B = F .05,2,12 =3.88 Fcritica l A×B = F .05,2,12 =3.88

Part b:

We test the simple main effect of factor A for each level of factor B.

For treatment I:

Treatments I
Male Female
n=3 M=3 SS=14 T=9 n=3 M=12 SS=14 T=36 G=9+9 =18 N=3+3 =6

S S Between = T 2 n G 2 N =[ ( 9 ) 2 3 + ( 9 ) 2 3 ] 18 2 6 =5454 =0 d f Between =I1 =21 =1 M S Between = S S Between d f Between = 0 1 =0 Using M S Within =8 from the original two-factor analysis, the final F-ratio is:

F= M S Between M S Within = 0 8 =0 From F table, at α=0.05 , the critical value is:

Fcritical= F .05,1,12 =4.75

There is no significant difference between males and females in treatment I.

For treatment II:

Treatments II
Male Female
n=3 M=6 SS=26 T=18 n=3 M=12 SS=14 T=36 G=18+36 =54 N=3+3 =6

S S Between = T 2 n G 2 N =[ ( 18 ) 2 3 + ( 36 ) 2 3 ] 54 2 6 =540486 =54 d f Between =I1 =21 =1 M S Between = S S Between d f Between = 54 1 =54 Using M S Within =8 from the original two-factor analysis, the final F-ratio is:

F= M S Between M S Within = 54 8 =6.75 From F table, at α=0.05 , the critical value is:

Fcritical= F .05,1,12 =4.75

There is significant difference between males and females in treatment II.

For treatment III:

Treatments III
Male Female
n=3 M=9 SS=8 T=27 n=3 M=15 SS=26 T=45 G=27+45 =72 N=3+3 =6

S S Between = T 2 n G 2 N =[ ( 27 ) 2 3 + ( 45 ) 2 3 ] 72 2 6 =918864 =54 d f Between =I1 =21 =1 M S Between = S S Between d f Between = 54 1 =54 Using M S Within =8 from the original two-factor analysis, the final F-ratio is:

F= M S Between M S Within = 54 8 =6.75 From F table, at α=0.05 , the critical value is:

Fcritical= F .05,1,12 =4.75

There is significant difference between males and females in treatment III.

Conclusion:

  1. There is a significant main effect for gender (Factor A) and treatment (Factor B) but there is no significant interaction.
  2. There is a significant difference between males and females in treatments II and III but not in treatment I.

Justification:

Since F A =9.00 is greater than 4.75, there is a significant main effect for gender (Factor A).

Since F B =15.75 is greater than 3.88, there is a significant main effect for treatment (Factor B).

Since F A×B =2.25 is less than 3.88, there is no significant interaction.

Want to see more full solutions like this?

Subscribe now to access step-by-step solutions to millions of textbook problems written by subject matter experts!
Students have asked these similar questions
The following data were obtained from an independent-measures research study comparing three treatment conditions. I II III     2 5 7                      5 2 3     0 1 6     1 2 4     2         2         T =12 T =10 T =20 G = 42   SS =14  SS =9 SS =10 ΣX2= 182   Use an ANOVA with α = .05 to determine whether there are any significant mean differences among the treatments. a. η2 is?
The data below are from an independent-measures experiment comparing three different treatment conditions. Use an ANOVA with a = .05 to determine whether these data indicate any significant differences among the treatments    Treatment 1 Treatment 2 Treatment 3   0 1 4 N = 12 0 4 3 G = 24 0 1 6 åX2 = 92 2 0 3           M = 0.5 T = 2 M = 1.5 T = 6 M = 4 T = 16   SS = 3 SS = 9 SS = 6
The following data are from a random sample of 10 students who participated in a study undertaken to investigate the effect of sleep time (measured in average number of hours of sleep per night) on GPA (grade point average, measured on a 4-point scale). Student Sleep time GPA 1 7 3.28 2 9 3.16 3 8 3.75 4 6 2.50 5 4 2.45 6 8 2.91 7 7 3.53 8 6 3.02 9 3 2.30 10 8 3.48 a. Find the equation between GPA (y) as function of sleep time (x). b. What is the estimated GPA of a student who averages 5 hours of sleep per night? c. What is the coefficient of determination?  *(no use EXCEL)

Chapter 14 Solutions

EP STATISTICS F/THE BEHAV.SCI.-MINDTAP

Introduction to experimental design and analysis of variance (ANOVA); Author: Dr. Bharatendra Rai;https://www.youtube.com/watch?v=vSFo1MwLoxU;License: Standard YouTube License, CC-BY