Videos
a.
Draw a dot plot using the 15 observations on number of violent crimes reported.
Find the schools that stand out from the rest.
a.
Answer to Problem 26E
The dot plot using the 15 observations on number of violent crimes reported is given below:
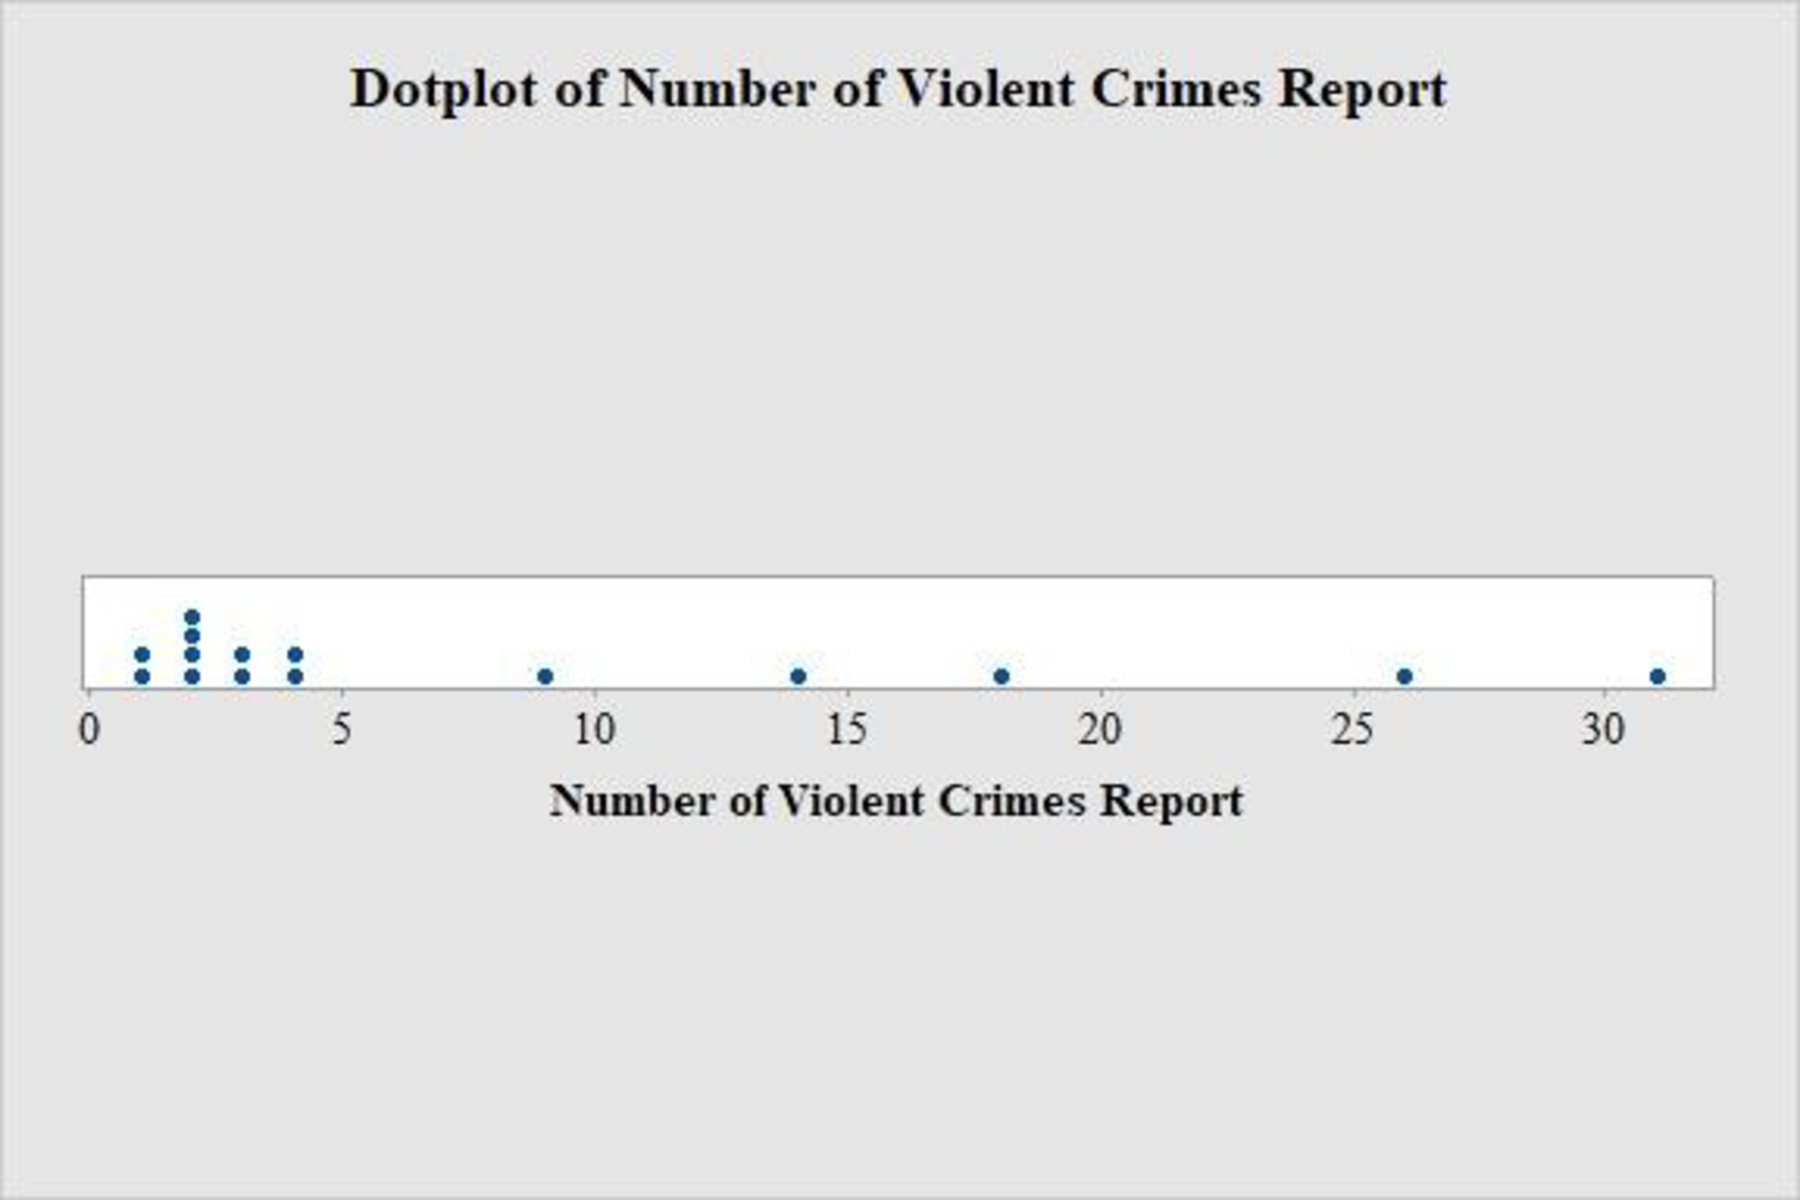
University of Florida, University of Central Florida and Florida State University are stand out from the rest.
Explanation of Solution
Calculation:
The data represents the number of violent crimes reported in 2012 on public college campuses in State F.
Software procedure:
Step-by-step procedure to obtain dot-plot using MINITAB software:
- Choose Graph > Dot plot.
- Choose One Y, select simple and then click OK.
- In Graph variables, enter the column of Number of Violent Crimes Report.
- Click OK.
Observation:
From the dot plot, it can be observed that three schools stand out from the rest, since higher number of crimes is reported in these schools compared to the rest.
Thus, the schools University of Florida, University of Central Florida and Florida State University are stand out from the rest.
b.
Find the violent crime rate for the other 14 schools and then draw a dot plot using these values.
Check whether the same schools stand out as unusual in this plot.
b.
Answer to Problem 26E
The violent crime rates for the other 14 schools are as follows:
| University/College | Violent Crime Rate Per 1,000 Students |
| Edison State College | 0.2338 |
| Florida A&M University | 1.0603 |
| Florida Atlantic University | 0.1584 |
| Florida Gulf Coast University | 0.2334 |
| Florida International University | 0.2017 |
| Florida State University | 0.7549 |
| New College of Florida | 1.18341 |
| Pensacola State College | 0.2602 |
| Santa Fe College | 0.0645 |
| Tallahassee Community College | 0.1325 |
| University of Central Florida | 0.4447 |
| University of Florida | 0.3630 |
| University of North Florida | 0.1235 |
| University of South Florida | 0.4640 |
| University of West Florida | 0.1669 |
The dot plot using the 15 observations on violent crime rate is given below:
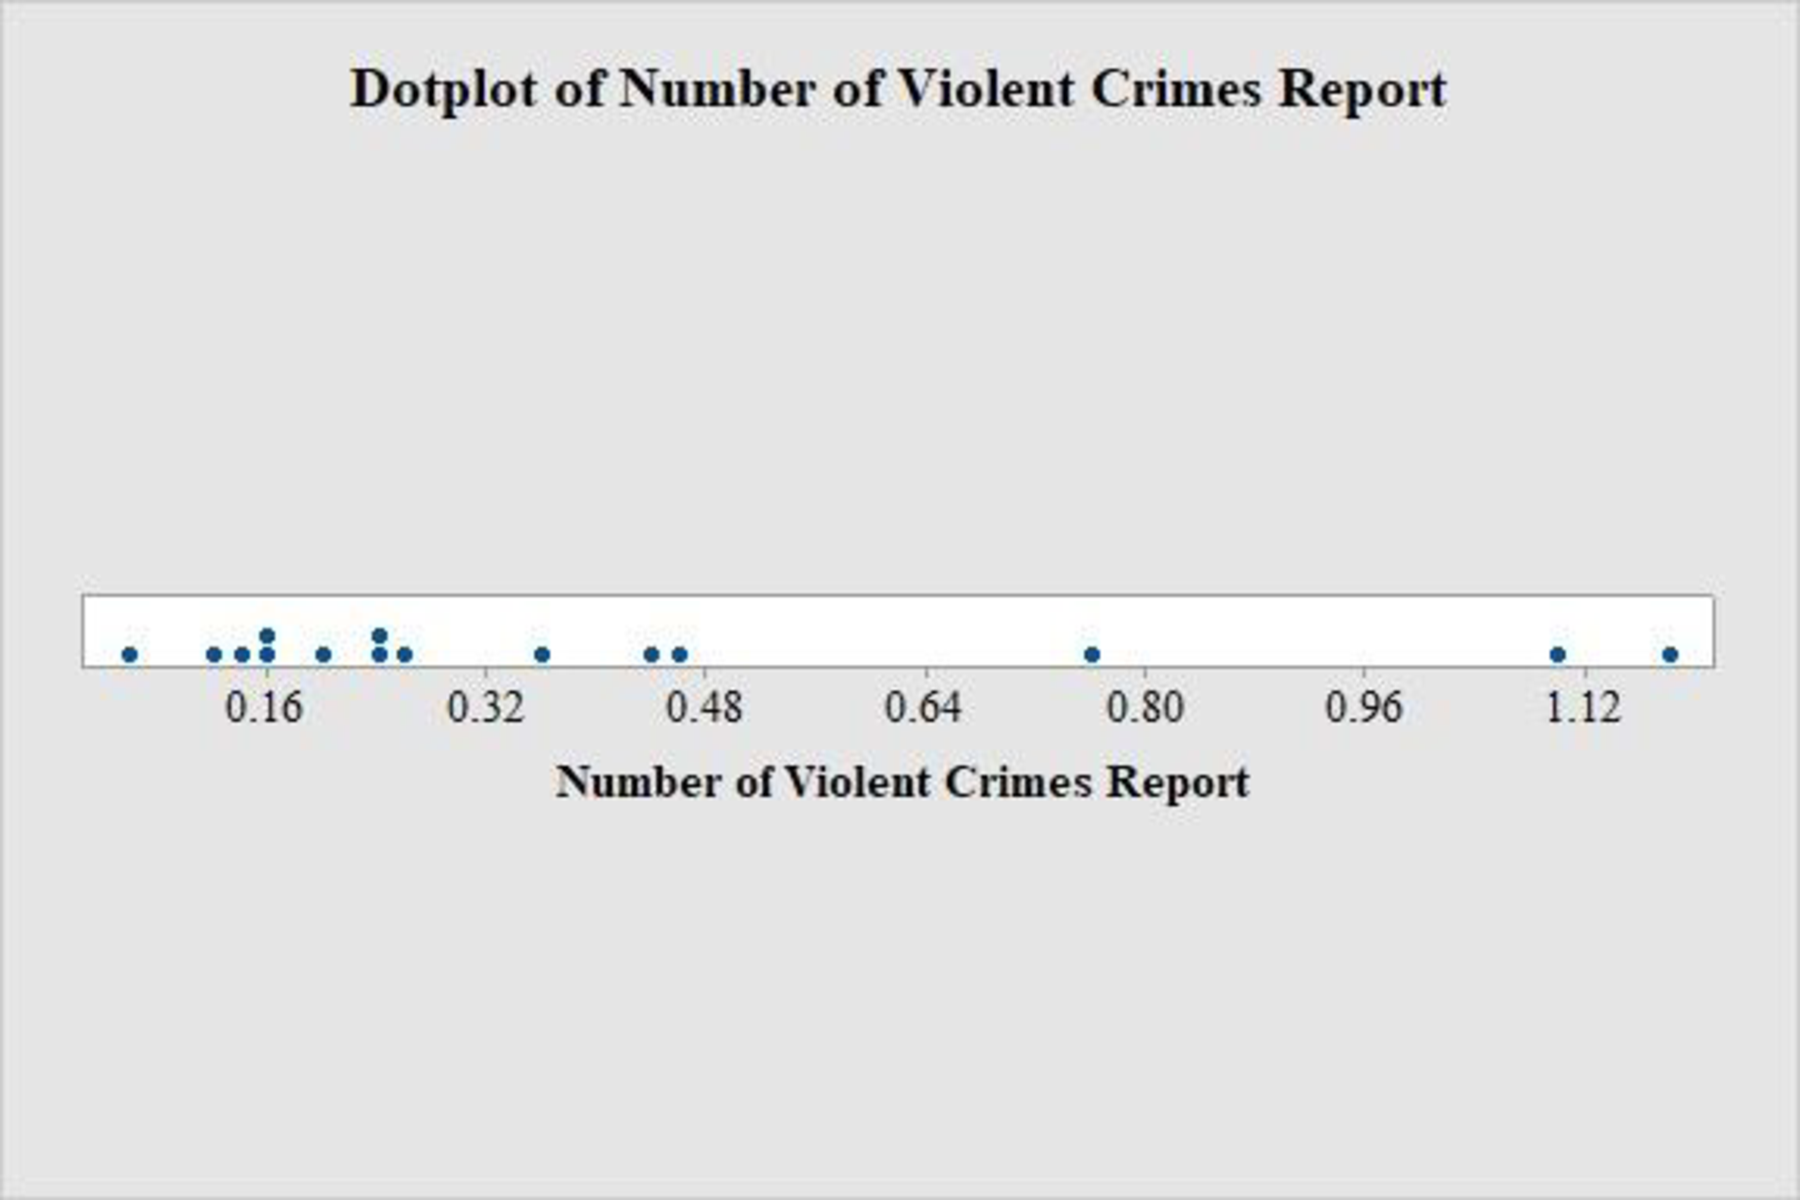
The schools stand out as unusual are not same.
Explanation of Solution
It is given that the violent crime rate for Florida A&M University is calculated as follows:
Then the violent crime rates for the other 14 schools are obtained as follows:
| University/College | Violent Crime Rate Per 1,000 Students |
| Edison State College | |
| Florida A&M University | |
| Florida Atlantic University | |
| Florida Gulf Coast University | |
| Florida International University | |
| Florida State University | |
| New College of Florida | |
| Pensacola State College | |
| Santa Fe College | |
| Tallahassee Community College | |
| University of Central Florida | |
| University of Florida | |
| University of North Florida | |
| University of South Florida | |
| University of West Florida |
Software procedure:
Step-by-step procedure to obtain dot-plot using MINITAB software:
- Choose Graph > Dot plot.
- Choose One Y, select simple and then click OK.
- In Graph variables, enter the column of Number of Violent Crimes Report.
- Click OK.
Observation:
From the dot plot, it can be observed that the schools Florida State University, Florida A&M University and New College of Florida stand out from the rest, since it has high crime rate than other schools.
Thus, the schools stand out as unusual are not same.
c.
Comment on the violent crimes reported at Florida universities and college in 2012 based on the part (a) and (b).
c.
Explanation of Solution
From part (a), it can be observed that there are three schools that stand out from the rest since these schools have higher number of crimes compared to the rest. However, majority of schools have almost similar and low number of crimes.
From part (b), it can be observed that there are three schools that stand out from the rest since these schools have higher crime rate compared to the rest.
Want to see more full solutions like this?
Chapter 1 Solutions
Introduction To Statistics And Data Analysis (with Jmp Printed Access Card)


 Functions and Change: A Modeling Approach to Coll...AlgebraISBN:9781337111348Author:Bruce Crauder, Benny Evans, Alan NoellPublisher:Cengage Learning
 Linear Algebra: A Modern IntroductionAlgebraISBN:9781285463247Author:David PoolePublisher:Cengage Learning