
Videos
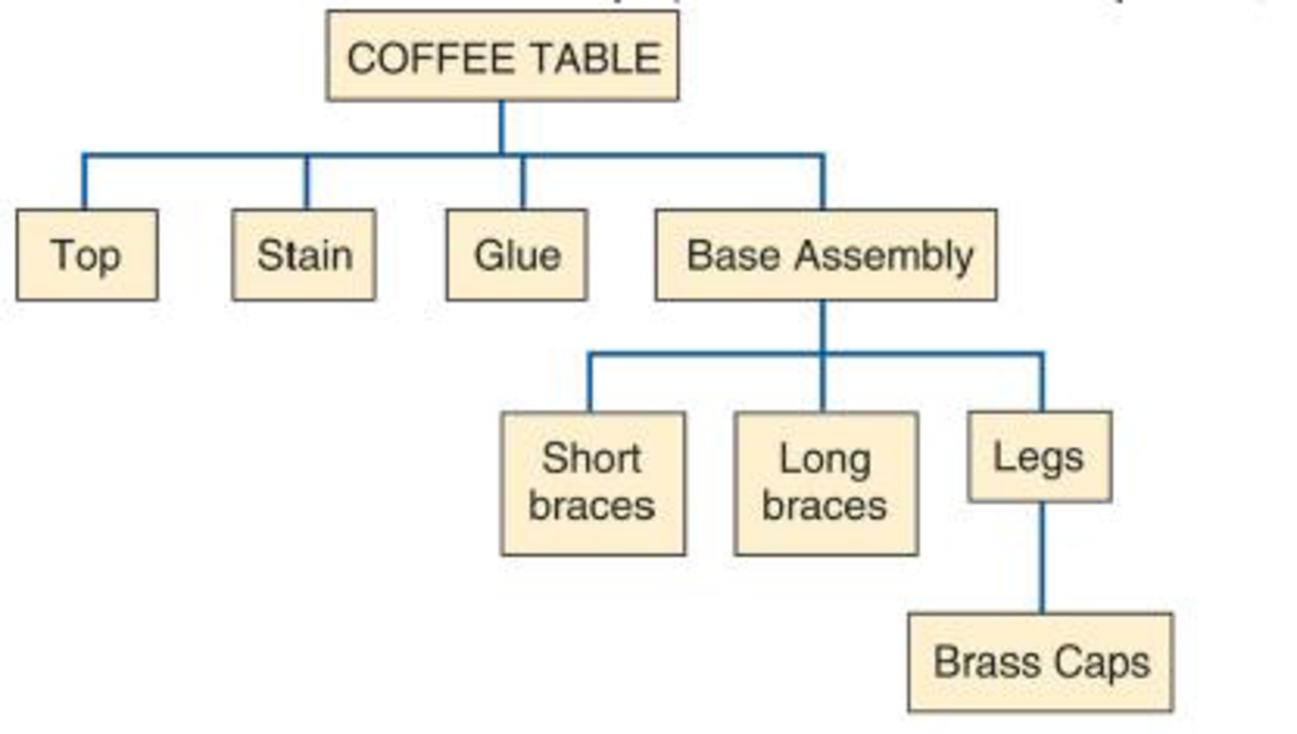
Using the data for the coffee table in Problem 14.26, build a labor schedule when the labor standard for each top is 2 labor hours; each leg including brass cap installation requires
•• 14.26 You are
Want to see the full answer?
Check out a sample textbook solution
Chapter 14 Solutions
EBK OPERATIONS MANAGEMENT


- Use a diagram to explain the concept of Throughput time and Bottleneck.arrow_forwardBelow is information related to: historical average processing times for Products A and B historical percentage of work center load required to produce Produdcts A and B routing and standard times to produce Product B • the product structure for Product B • a MPS covering 3 periods for Products A and B. MPS in Units End Product 2 Processing Time A 50 45 25 Historical % End Product Hours/Unit wC B. 30 25 30 100 40% A 0.80 200 50% в 1.6 300 10% Routing and Standard Time Data End Product Lot Size Work Center Set Up (Hrs) Run Time/Unit (Hrs) Hrs/Unit B 40 100 1 1.25 D (3 required) D 50 200 0.07 100 200 0.08 F 100 300 0.04 (2 required) A. Develp a rough cut capacity plan for the three work centers based on historical factors. Please fill in the table below with your final calculations. Show your work in the space belov Historical Total Work Center Percentage 1 2 3 Hours 100 200 300 Total Required Capacity Show any work here:arrow_forwardwhat is process time?arrow_forward
- kindly do question 5 & 6 pls. thx Kiko Teddy Bear is a manufacturer of stuffed teddy bears. Kiko would like to be able to produce 40 teddy bears per hour on its assembly line. The following information will assist in answering the questions that follow: Task Information for Kiko Teddy Bear Work Element Task Description Immediate Predecessor Task Time (in seconds) A Cut teddy bear pattern None 90 B Sew teddy bear cloth A 75 C Stuff teddy bear B 50 D Glue on eyes C 20 E Glue on nose C 15 F Sew on mouth C 35 G Attach manufacturer’s label B 15 H Inspect and pack teddy bear D,E,F,G 40 Draw a precedence diagram. What cycle time would provide the desired output? What is the maximum possible output of the line?…arrow_forwardFor manufacturing electric bus Total labor hours, estimation process, and summary resultsarrow_forwardAnalyze bottleneck resources and apply TOC principles to controlling a process.arrow_forward
- .A paced assembly line has been devised to manufacture calculators, as the following data show: Station S1 S2 S3 S4 S5 S6 Work Element Assigned A D, E с B, F, G H, I, J K Work Element Time (min) 2.7 0.6, 0.9 3.0 0.7, 0.7, 0.9 0.7, 0.3, 1.2 2.4 . What is the maximum hourly output rate from this line? (Hint: The line can go only as fast as its slowest workstation.) ». What cycle time corresponds to this maximum output rate? c. If a worker is at each station and the line operates at this maximum output rate, how much idle time is lost during each 10-hour shift? H. What is the line's efficiency?arrow_forwardSuppose the times for the individual operations for the in-line skate assembly are as follows: Task Description Time (sec) 1 Assemble wheels, bearings, and axle hardware 19 2 Assemble brake housing and pad 17 Complete wheel assembly 35 4 Inspect wheel assembly 20 Assemble boot 35 6 Join boot and wheel subassemblies 16 7 Add line and final assembly 20 8 Perform final inspection 14 Consider the production line achieving an output rate of 100 per hour below. Using the proposed design, calculate the total time and idle time for each workstation. If your answer is zero, enter "0". Round your answers to the nearest whole number. Task5 Task1 Task 7 Task3 Task2 Task8 Task 4 Task6 Station Tasks Total Time, Idle Time, seconds seconds A 1 and 2 B 3 D 4 and 6 E 7 and 8 Total What is the assembly line efficiency? Round your answer to one decimal place. %arrow_forwardExamine the pros and cons of using a Work Breakdown Structure against a Product Breakdown Structure.arrow_forward
- Identify the commonly used approaches for effectivelyredesigning and managing processes.arrow_forwardТАT TAT in hours TAT inside the plant 4.25 Activity wise TAT TAT inside the plant Ideal Actual TAT TAT(mins) (mins) Gate-in from truck yard 15 mins 65mins Loading 35 mins 95mins Security Check 15 mins 35mins Invoicing 10 mins 45mins Gate-out 2 mins 15minsarrow_forward"Discuss the difference between resource loading and resource leveling, and provide an example of when you would use each technique"arrow_forward
 Practical Management ScienceOperations ManagementISBN:9781337406659Author:WINSTON, Wayne L.Publisher:Cengage,
 Operations ManagementOperations ManagementISBN:9781259667473Author:William J StevensonPublisher:McGraw-Hill Education
 Operations and Supply Chain Management (Mcgraw-hi...Operations ManagementISBN:9781259666100Author:F. Robert Jacobs, Richard B ChasePublisher:McGraw-Hill Education
 Purchasing and Supply Chain ManagementOperations ManagementISBN:9781285869681Author:Robert M. Monczka, Robert B. Handfield, Larry C. Giunipero, James L. PattersonPublisher:Cengage Learning
 Production and Operations Analysis, Seventh Editi...Operations ManagementISBN:9781478623069Author:Steven Nahmias, Tava Lennon OlsenPublisher:Waveland Press, Inc.