
EBK CORPORATE FINANCE
11th Edition
ISBN: 8220102798878
Author: Ross
Publisher: YUZU
expand_more
expand_more
format_list_bulleted
Concept explainers
Videos
Textbook Question
Chapter 14, Problem 3QP
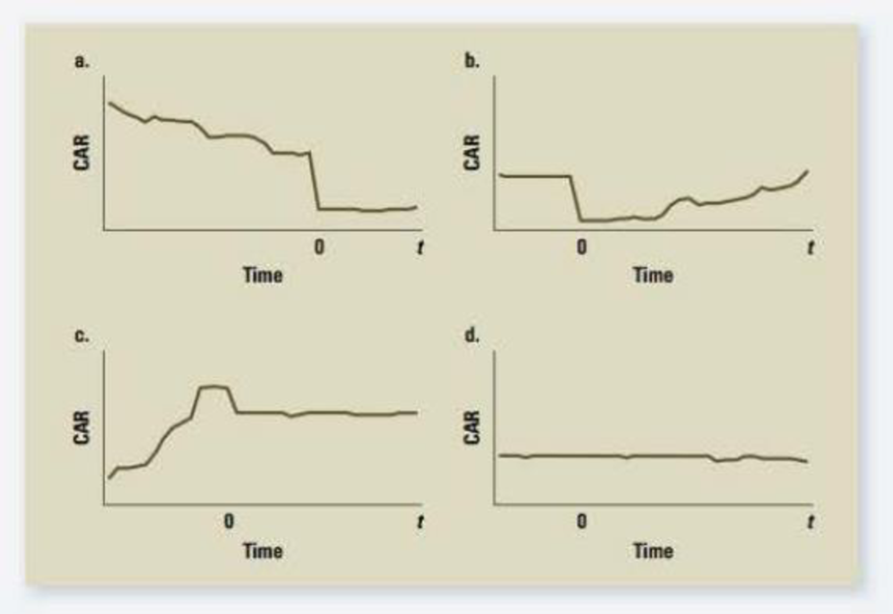
Cumulative Abnormal Returns The following figures present the results of four cumulative abnormal returns (CAR) studies. Indicate whether the results of each study support, reject, or arc inconclusive about the semistrong form of the
Expert Solution & Answer
Want to see the full answer?
Check out a sample textbook solution
Students have asked these similar questions
In creating the T2 measure one mixes P* and T-bills to match the _____ of the market and in creating the M2 measure one mixes P* and T-bills to match the _____ of the market.
Group of answer choices
beta, alpha
alpha, beta
standard deviation, beta
beta, standard deviation
Explain why, empirically, there is mean reversion in abnormal earnings. If you divide the sample into deciles according to scaled current levels of abnormal
earnings, which stocks show the greatest abnormal earnings persistence?
Which of the following is (are) correct regarding average returns?
A
The geometric mean is a better measure of an investor's effective return over several periods than the arithmetic mean.
B
The arithmetic mean is the average return for a series of returns and will always be less than or equal to the geometric mean.
C
Both a and b.
D
Neither a nor b.
Chapter 14 Solutions
EBK CORPORATE FINANCE
Ch. 14 - Prob. 1CQCh. 14 - Prob. 2CQCh. 14 - Efficient Market Hypothesis Which of the following...Ch. 14 - Market Efficiency Implications Explain why a...Ch. 14 - Efficient Market Hypothesis A stock market analyst...Ch. 14 - Semistrong Efficiency If a market is semistrong...Ch. 14 - Efficient Market Hypothesis What are the...Ch. 14 - Prob. 8CQCh. 14 - Prob. 9CQCh. 14 - Efficient Market Hypothesis For each of the...
Ch. 14 - Technical Analysis What would a technical analyst...Ch. 14 - Prob. 12CQCh. 14 - Prob. 13CQCh. 14 - Efficient Markets A hundred years ago or so,...Ch. 14 - Efficient Market Hypothesis Aerotech, an aerospace...Ch. 14 - Prob. 16CQCh. 14 - Prob. 17CQCh. 14 - Efficient Market Hypothesis Newtech Corp. is going...Ch. 14 - Prob. 19CQCh. 14 - Efficient Market Hypothesis The Durkin Investing...Ch. 14 - Efficient Market Hypothesis Your broker commented...Ch. 14 - Efficient Market Hypothesis A famous economist...Ch. 14 - Efficient Market Hypothesis Suppose the market is...Ch. 14 - Prob. 24CQCh. 14 - Prob. 25CQCh. 14 - Efficient Market Hypothesis Assume that markets...Ch. 14 - Prob. 27CQCh. 14 - Evidence on Market Efficiency Some people argue...Ch. 14 - Prob. 1QPCh. 14 - Cumulative Abnormal Returns The following diagram...Ch. 14 - Cumulative Abnormal Returns The following figures...Ch. 14 - Prob. 4QPCh. 14 - Prob. 1MCCh. 14 - Prob. 2MCCh. 14 - Prob. 3MC
Knowledge Booster


Learn more about
Need a deep-dive on the concept behind this application? Look no further. Learn more about this topic, finance and related others by exploring similar questions and additional content below.Similar questions
- Consider the following time series data: Construct a time series plot. What type of pattern exists in the data? Use a multiple regression model with dummy variables as follows to develop an equation to account for seasonal effects in the data: Qtr1 = 1 if quarter 1, 0 otherwise; Qtr2 = 1 if quarter 2. 0 otherwise; Qtr3 = 1 if quarter 3, 0 otherwise. Compute the quarterly forecasts for next year based on the model you developed in part (b). Use a multiple regression model to develop an equation to account for trend and seasonal effects in the data. Use the dummy variables you developed in part (b) to capture seasonal effects and create a variable t such that t = 1 for quarter 1 in year 1, t = 2 for quarter 2 in year 1, … t = 12 for quarter 4 in year 3. Compute the quarterly forecasts for next year based on the model you developed in part (d). Is the model you developed in part (b) or the model you developed in part (d) more effective? Justify your answer.arrow_forwardPlease fill out the parts in the above table that are shaded in yellow. You will notice that there are nine line items Please answer : Covariance with MP Correlation with Market Index Beta CAPM Req. Returnarrow_forwardThe Beta coefficients of TSLA and JPM are 1.99 and 1.18 respectively. What does Beta measure and how is it interpreted? Explain the beta values of TSLA and JPM by providing a calculated example of how they relate to market returns.arrow_forward
- The variance ratio (VR) can be used to determine whether returns satisfy the efficient market hypothesis (EMH). Let n = 5 and r5,t be the five period log return at time t, where t = 1, 2,..., T. 1. Express (r5,t — Ã5) in terms of deviations of the relevant one period log returns from their respective means. Denote 75 to be the mean of the five period log return.arrow_forwardCG's full data analysis, 1971-2003, revealed that Market Q was insignificant. That is, there was no impact on firm investment rates from market prices. Why do you think this is the case? Select one: O a. Fundamental Q captures all information relevant to make investment choices. O b. No mis-pricing in any other periods except the 1990s. O c. Fixed Effects in the regression controls for and averages out any time variation in the market prices.arrow_forwardThe historical rate of return on stock A was regressed on the rate of return of stock M (the explanatory variable). The slope of the regression line was 0.8, the standard deviation of the residuals was 0.3 and the standard deviation of the rate of return of M was 0.2. What was the standard deviation of the rate of return on A? Multiple Choice 0.460 None of the above 0.286 0.349 Next >arrow_forward
- If two returns are positively related to each other, they will have a ________, and if they are negatively related to each other, the ______________. Group of answer choices positive covariance, covariance will be negative positive covariance, standard deviation will be negative negative covariance, covariance will be zero negative covariance, covariance will be positive This type of risk affects a large number of assets, each to a greater or lesser degree. Group of answer choices systematic risk unsystematic risk idiosynchratic risk principle of diversification True/False. The Dividend Discount Model can be applied to firms that do not pay dividends. Group of answer choices True Falsearrow_forward2) What was the standard deviation of the risk premium? (Ignore that the estimation is from a sample of data.) (Do not round intermediate calculations. Enter your answer as a percent rounded to 2 decimal places.) 3) What was the average risk premium? (Do not round intermediate calculations. Enter your answer as a percent rounded to 2 decimal places.)arrow_forwardConsider the following data for a dependent variable y and two independent variables, x1 and 12. 30 12 94 47 10 109 25 18 112 51 16 178 40 94 51 19 175 75 171 36 12 118 59 13 143 77 17 212 Round your all answers to two decimal places. Enter negative values as negative numbers, if necessary. a. Develop an estimated regression equation relating Y to ¤1. Predict y if æ1 = 35. b. Develop an estimated regression equation relating y to x2. ŷ = + Predict y if x2 = 25. ŷ = c. Develop an estimated regression equation relating y to ¤1 and 2. Predict y if x1 = 35 and x2 = 25. ŷ =arrow_forward
- Which of the following statements is INCORRECT about the Random Walk Hypothesis? A) It assumes successive returns are statistically independent. B) It assumes there is no correlation between the returns in one period and the next. C) It assumes the distribution of returns in all periods is identical. D) It assumes historical share prices can be used to predict future price movements.arrow_forwardBeta calculations are subject to which of the following limitations? a. The market's rate of return varies from year to year. b. Beta is known to be erratic and unpredictable. c. Collecting rate of return data on individual assets is difficult. d. Beta is determined from historical data, and the stock's characteristics might have changed since hte measurement was performed.arrow_forwardThe correlation with Market index, Beta and CAPM Req. Return worked out manually.arrow_forward
arrow_back_ios
SEE MORE QUESTIONS
arrow_forward_ios
Recommended textbooks for you
 Essentials of Business Analytics (MindTap Course ...StatisticsISBN:9781305627734Author:Jeffrey D. Camm, James J. Cochran, Michael J. Fry, Jeffrey W. Ohlmann, David R. AndersonPublisher:Cengage Learning
Essentials of Business Analytics (MindTap Course ...
Statistics
ISBN:9781305627734
Author:Jeffrey D. Camm, James J. Cochran, Michael J. Fry, Jeffrey W. Ohlmann, David R. Anderson
Publisher:Cengage Learning
Portfolio return, variance, standard deviation; Author: MyFinanceTeacher;https://www.youtube.com/watch?v=RWT0kx36vZE;License: Standard YouTube License, CC-BY