
College Algebra In Context, Loose-leaf Edition Plus Mylab Math With Pearson Etext -- 18 Week Access Card Package (5th Edition)
5th Edition
ISBN: 9780136175933
Author: Ronald J. Harshbarger, Lisa S. Yocco
Publisher: PEARSON
expand_more
expand_more
format_list_bulleted
Videos
Textbook Question
Chapter 1.4, Problem 65E
Working Age The scatter plot below projects the ratio of the working-age population to the elderly.
a. Do the data appear to fit a linear function?
b. The data points shown in the scatter plot from 2010 to 2030 are projections made from a mathematical model. Do those projections appear to be made with a linear model? Explain.
c. If the ratio is 3.9 in 2010 and projected to be 2.2 in 2030, what is the average annual rate of change of the data over this period of time?
d. Write the equation of the line joining these two points.
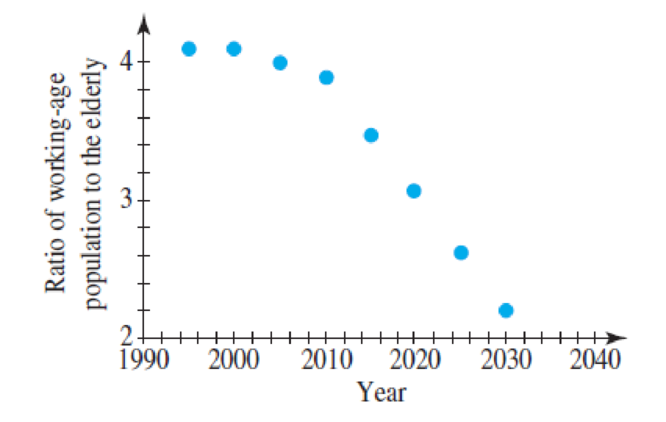
(Source: Newsweek)
Expert Solution & Answer
Want to see the full answer?
Check out a sample textbook solution
Chapter 1 Solutions
College Algebra In Context, Loose-leaf Edition Plus Mylab Math With Pearson Etext -- 18 Week Access Card Package (5th Edition)
Ch. 1.1 - Use the tables below in Exercises 16. 1.Table A...Ch. 1.1 - Use the tables below in Exercises 16. 2.Table B...Ch. 1.1 - Use the tables below in Exercises 16. 3.Use Table...Ch. 1.1 - Use the tables below in Exercises 16. 4.Use Table...Ch. 1.1 - Use the tables below in Exercises 16. 5.Does Table...Ch. 1.1 - Use the tables below in Exercises 16. 6.Does Table...Ch. 1.1 - For each of the functions y = f(x) described...Ch. 1.1 - For each of the functions y = f(x) described...Ch. 1.1 - In Exercises 9 and 10, refer to the graph of the...Ch. 1.1 - Prob. 10E
Ch. 1.1 - If R(x) = 5x + 8, find (a) R(3), (b) R(1), and (c)...Ch. 1.1 - Prob. 12ECh. 1.1 - Does the table below define y as a function of x?...Ch. 1.1 - Prob. 14ECh. 1.1 - Prob. 15ECh. 1.1 - Determine if each graph in Exercises 1518...Ch. 1.1 - Prob. 17ECh. 1.1 - Determine if each graph in Exercises 1518...Ch. 1.1 - Determine whether the graph in the figure...Ch. 1.1 - Prob. 20ECh. 1.1 - Which of the following sets of ordered pairs...Ch. 1.1 - Which of the following sets of ordered pairs...Ch. 1.1 - Which of the following arrow diagrams defines a...Ch. 1.1 - Which of the following arrow diagrams defines a...Ch. 1.1 - In Exercises 2530, find the domain and range for...Ch. 1.1 - In Exercises 2530, find the domain and range for...Ch. 1.1 - In Exercises 2530, find the domain and range for...Ch. 1.1 - In Exercises 2530, find the domain and range for...Ch. 1.1 - In Exercises 2530, find the domain and range for...Ch. 1.1 - In Exercises 2530, find the domain and range for...Ch. 1.1 - If a model has inputs aligned so that X = the...Ch. 1.1 - If a set of data from the years 1990 to 2015 is...Ch. 1.1 - Does x2 + y2 = 4 describe y as a function of x?Ch. 1.1 - Does x2 + 2y = 9 descrbelas a function of x?Ch. 1.1 - The American Lung Association distributes a...Ch. 1.1 - Write an equation to represent the function...Ch. 1.1 - Say F represents a Fahrenheit temperature and C...Ch. 1.1 - Write a verbal statement to represent the function...Ch. 1.1 - In Exercises 3941, determine whether the given...Ch. 1.1 - In Exercises 3941, determine whether the given...Ch. 1.1 - In Exercises 3941, determine whether the given...Ch. 1.1 - Prob. 42ECh. 1.1 - Barcodes A grocery scanner at Safeway connects the...Ch. 1.1 - Piano A childs piano has 12 keys, each of which...Ch. 1.1 - Prob. 45ECh. 1.1 - Prob. 46ECh. 1.1 - Prob. 47ECh. 1.1 - Prob. 48ECh. 1.1 - Prob. 49ECh. 1.1 - Mortgage A couple can afford 800 per month to...Ch. 1.1 - Prob. 51ECh. 1.1 - Working Age The projected ratio of the working-age...Ch. 1.1 - Age at First Marriage The table on the following...Ch. 1.1 - Population of Females under 18 The graph below...Ch. 1.1 - Alzheimers Disease The figure gives the millions...Ch. 1.1 - Prob. 56ECh. 1.1 - Prob. 57ECh. 1.1 - Social Security Funding Social Security benefits...Ch. 1.1 - Prob. 59ECh. 1.1 - Prob. 60ECh. 1.1 - Utilities An electric utility company determines...Ch. 1.1 - Prob. 62ECh. 1.1 - Prob. 63ECh. 1.1 - Projectiles Suppose a ball thrown into the air has...Ch. 1.1 - Test Reliability If a test that has reliability...Ch. 1.1 - Body-Heat Loss The description of body-heat loss...Ch. 1.1 - Prob. 67ECh. 1.1 - Prob. 68ECh. 1.1 - Prob. 69ECh. 1.1 - Height of a Bullet The height of a bullet shot...Ch. 1.2 - a.Complete the table of values for the function y...Ch. 1.2 - Prob. 2ECh. 1.2 - Prob. 3ECh. 1.2 - In Exercises 38, make a table of values for each...Ch. 1.2 - In Exercises 38, make a table of values for each...Ch. 1.2 - Prob. 6ECh. 1.2 - Prob. 7ECh. 1.2 - Prob. 8ECh. 1.2 - Prob. 9ECh. 1.2 - Prob. 10ECh. 1.2 - Prob. 11ECh. 1.2 - Prob. 12ECh. 1.2 - Prob. 13ECh. 1.2 - Prob. 14ECh. 1.2 - Prob. 15ECh. 1.2 - Prob. 16ECh. 1.2 - For Exercises 1518, graph the given function with...Ch. 1.2 - Prob. 18ECh. 1.2 - Prob. 19ECh. 1.2 - For Exercises 1922, find an appropriate viewing...Ch. 1.2 - Prob. 21ECh. 1.2 - Prob. 22ECh. 1.2 - Prob. 23ECh. 1.2 - Prob. 24ECh. 1.2 - Prob. 25ECh. 1.2 - Prob. 26ECh. 1.2 - Prob. 27ECh. 1.2 - Prob. 28ECh. 1.2 - Prob. 29ECh. 1.2 - Prob. 30ECh. 1.2 - Suppose f(x)=x25x million dollars are earned,...Ch. 1.2 - Prob. 32ECh. 1.2 - Prob. 33ECh. 1.2 - Prob. 34ECh. 1.2 - In Exercises 3338, plot the graphs by hand....Ch. 1.2 - In Exercises 3338, plot the graphs by hand....Ch. 1.2 - Prob. 37ECh. 1.2 - Prob. 38ECh. 1.2 - Prob. 39ECh. 1.2 - Prob. 40ECh. 1.2 - Prob. 41ECh. 1.2 - Prob. 42ECh. 1.2 - Prob. 43ECh. 1.2 - Life Expectancy at 65 Using data for selected...Ch. 1.2 - Student Loans Data for selected years from 2011...Ch. 1.2 - Prob. 46ECh. 1.2 - Prob. 47ECh. 1.2 - Prob. 48ECh. 1.2 - Obesity Using data from 2000 and projected to...Ch. 1.2 - Cocaine Use The percent of high school seniors...Ch. 1.2 - Prob. 51ECh. 1.2 - Prob. 52ECh. 1.2 - Prob. 53ECh. 1.2 - Prob. 54ECh. 1.2 - Prob. 55ECh. 1.2 - Prob. 56ECh. 1.3 - Which of the following functions are linear?...Ch. 1.3 - Is the graph in the figure below a function?Ch. 1.3 - Find the slope of the line through (4, 6) and (28,...Ch. 1.3 - Find the slope of the line through (8, 10) and (8,...Ch. 1.3 - Find the slope of the line in the graph that...Ch. 1.3 - Find the slope of the line in the graph below.Ch. 1.3 - In Exercises 710, (a) find the x- and y-intercepts...Ch. 1.3 - In Exercises 710, (a) find the x- and y-intercepts...Ch. 1.3 - In Exercises 710, (a) find the x- and y-intercepts...Ch. 1.3 - In Exercises 710, (a) find the x- and y-intercepts...Ch. 1.3 - If a line is horizontal, then its slope is _____....Ch. 1.3 - Describe the line whose slope was determined in...Ch. 1.3 - For Exercises 1314, determine whether the slope of...Ch. 1.3 - For Exercises 1314, determine whether the slope of...Ch. 1.3 - For Exercises 1518, (a) give the slope of the line...Ch. 1.3 - For Exercises 1518, (a) give the slope of the line...Ch. 1.3 - For Exercises 1518, (a) give the slope of the line...Ch. 1.3 - For Exercises 1518, (a) give the slope of the line...Ch. 1.3 - For each of the functions in Exercises 1921, do...Ch. 1.3 - For each of the functions in Exercises 1921, do...Ch. 1.3 - Prob. 21ECh. 1.3 - Prob. 22ECh. 1.3 - Prob. 23ECh. 1.3 - Prob. 24ECh. 1.3 - Prob. 25ECh. 1.3 - Prob. 26ECh. 1.3 - Prob. 27ECh. 1.3 - Prob. 28ECh. 1.3 - Prob. 29ECh. 1.3 - Prob. 30ECh. 1.3 - Prob. 31ECh. 1.3 - Prob. 32ECh. 1.3 - College Enrollment The total fall enrollment in...Ch. 1.3 - Women in the Workforce Using data and projections...Ch. 1.3 - Life Expectancy at 65 Using data for selected...Ch. 1.3 - Prob. 36ECh. 1.3 - Prob. 37ECh. 1.3 - Prob. 38ECh. 1.3 - Prob. 39ECh. 1.3 - Prob. 40ECh. 1.3 - Life Insurance The monthly rates for a 100,000...Ch. 1.3 - Prob. 42ECh. 1.3 - Prob. 43ECh. 1.3 - Prob. 44ECh. 1.3 - Women in the Workforce Using data from 1950 and...Ch. 1.3 - Prob. 46ECh. 1.3 - Prob. 47ECh. 1.3 - Prob. 48ECh. 1.3 - Prob. 49ECh. 1.3 - Wireless Service Spending The total amount spent...Ch. 1.3 - Prob. 51ECh. 1.3 - Internet Users The percent of the U.S. population...Ch. 1.3 - Depreciation Suppose the cost of a business...Ch. 1.3 - Prob. 54ECh. 1.3 - Prob. 55ECh. 1.3 - Prob. 56ECh. 1.3 - Prob. 57ECh. 1.3 - Marginal Cost Suppose the monthly total cost for...Ch. 1.3 - Prob. 59ECh. 1.3 - Prob. 60ECh. 1.3 - Prob. 61ECh. 1.3 - Prob. 62ECh. 1.4 - For Exercises 118, write the equation of the line...Ch. 1.4 - For Exercises 118, write the equation of the line...Ch. 1.4 - For Exercises 118, write the equation of the line...Ch. 1.4 - For Exercises 118, write the equation of the line...Ch. 1.4 - For Exercises 118, write the equation of the line...Ch. 1.4 - For Exercises 118, write the equation of the line...Ch. 1.4 - For Exercises 118, write the equation of the line...Ch. 1.4 - For Exercises 118, write the equation of the line...Ch. 1.4 - For Exercises 118, write the equation of the line...Ch. 1.4 - For Exercises 118, write the equation of the line...Ch. 1.4 - For Exercises 118, write the equation of the line...Ch. 1.4 - For Exercises 118, write the equation of the line...Ch. 1.4 - For Exercises 118, write the equation of the line...Ch. 1.4 - For Exercises 118, write the equation of the line...Ch. 1.4 - For Exercises 118, write the equation of the line...Ch. 1.4 - For Exercises 118, write the equation of the line...Ch. 1.4 - For Exercises 118, write the equation of the line...Ch. 1.4 - For Exercises 118, write the equation of the line...Ch. 1.4 - For Exercises 1922, write the equation of the line...Ch. 1.4 - For Exercises 1922, write the equation of the line...Ch. 1.4 - For Exercises 1922, write the equation of the line...Ch. 1.4 - For Exercises 1922, write the equation of the line...Ch. 1.4 - Write the equation of a function if its rate of...Ch. 1.4 - Write the equation of a function if its rate of...Ch. 1.4 - If a function has rate of change 23 and y = 9,...Ch. 1.4 - If a function has rate of change 15 and y = 12...Ch. 1.4 - Prob. 27ECh. 1.4 - Prob. 28ECh. 1.4 - For the function shown in the figure, find the...Ch. 1.4 - Prob. 30ECh. 1.4 - Prob. 31ECh. 1.4 - Prob. 32ECh. 1.4 - Prob. 33ECh. 1.4 - Prob. 34ECh. 1.4 - For the functions given in Exercises 3336, find...Ch. 1.4 - For the functions given in Exercises 3336, find...Ch. 1.4 - Prob. 37ECh. 1.4 - Prob. 38ECh. 1.4 - Prob. 39ECh. 1.4 - Prob. 40ECh. 1.4 - Prob. 41ECh. 1.4 - Sleep Each day a young person should sleep 8 hours...Ch. 1.4 - Prob. 43ECh. 1.4 - Heart Rate The desired heart rate for cardiac...Ch. 1.4 - Prob. 45ECh. 1.4 - Prob. 46ECh. 1.4 - Prob. 47ECh. 1.4 - Prob. 48ECh. 1.4 - Prob. 49ECh. 1.4 - Cost A company buys and retails baseball caps. The...Ch. 1.4 - Prob. 51ECh. 1.4 - Prob. 52ECh. 1.4 - Social Security Monthly social security benefits...Ch. 1.4 - Consumer Price Index Goods and services that cost...Ch. 1.4 - Prob. 55ECh. 1.4 - Blood Alcohol Percent The table below gives the...Ch. 1.4 - Prob. 57ECh. 1.4 - World Population The figure shows the real and...Ch. 1.4 - Prob. 59ECh. 1.4 - Prob. 60ECh. 1.4 - Women in the Workforce The number of women in the...Ch. 1.4 - Prob. 62ECh. 1.4 - Prison Population The graph showing the total...Ch. 1.4 - Investment The graph of the future value of an...Ch. 1.4 - Working Age The scatter plot below projects the...Ch. 1.4 - Women in the Workforce The number of women in the...Ch. 1.4 - Prob. 67ECh. 1.4 - Social Agency A social agency provides emergency...Ch. 1.4 - Average Velocity A ball is shot straight upward,...Ch. 1.4 - Prob. 70ECh. 1.4 - Prob. 71ECh. 1.4 - Prob. 72ECh. 1 - Write the set of all natural numbers N less than 9...Ch. 1 - Is it true that 3{1,3,4,6,8,9,10}?Ch. 1 - Prob. 3TECh. 1 - Prob. 4TECh. 1 - Prob. 5TECh. 1 - Are sets of rational numbers and irrational...Ch. 1 - Prob. 7TECh. 1 - Prob. 8TECh. 1 - Identify the sets of numbers in Exercises 79 as...Ch. 1 - Prob. 10TECh. 1 - Prob. 11TECh. 1 - Prob. 12TECh. 1 - Prob. 13TECh. 1 - Prob. 14TECh. 1 - In Exercises 1315, express each inequality or...Ch. 1 - Prob. 16TECh. 1 - Prob. 17TECh. 1 - Prob. 18TECh. 1 - Prob. 19TECh. 1 - Prob. 20TECh. 1 - Prob. 21TECh. 1 - Prob. 22TECh. 1 - Plot the points (x1, y1) and (x2, y2) on a...Ch. 1 - Prob. 24TECh. 1 - Determine whether each expression in Exercises...Ch. 1 - Prob. 26TECh. 1 - Prob. 27TECh. 1 - Prob. 28TECh. 1 - Prob. 29TECh. 1 - Prob. 30TECh. 1 - Prob. 31TECh. 1 - Prob. 32TECh. 1 - Prob. 33TECh. 1 - Prob. 34TECh. 1 - Prob. 35TECh. 1 - Prob. 36TECh. 1 - Prob. 37TECh. 1 - Prob. 38TECh. 1 - Prob. 39TECh. 1 - In Exercises 3842, find the products....Ch. 1 - Prob. 41TECh. 1 - Prob. 42TECh. 1 - Prob. 43TECh. 1 - Prob. 44TECh. 1 - Prob. 1RECh. 1 - Prob. 2RECh. 1 - Prob. 3RECh. 1 - Prob. 4RECh. 1 - Prob. 5RECh. 1 - Prob. 6RECh. 1 - Prob. 7RECh. 1 - Graph the function y = 3x2.Ch. 1 - Prob. 9RECh. 1 - Prob. 10RECh. 1 - Prob. 11RECh. 1 - Prob. 12RECh. 1 - Prob. 13RECh. 1 - Prob. 14RECh. 1 - Prob. 15RECh. 1 - Prob. 16RECh. 1 - Prob. 17RECh. 1 - Prob. 18RECh. 1 - Prob. 19RECh. 1 - Prob. 20RECh. 1 - Prob. 21RECh. 1 - Prob. 22RECh. 1 - Prob. 23RECh. 1 - Prob. 24RECh. 1 - Prob. 25RECh. 1 - Prob. 26RECh. 1 - Prob. 27RECh. 1 - Prob. 28RECh. 1 - Prob. 29RECh. 1 - Prob. 30RECh. 1 - Prob. 31RECh. 1 - Life Expectancy The figure gives the number of...Ch. 1 - Life Expectancy The figure gives the number of...Ch. 1 - Prob. 34RECh. 1 - Prob. 35RECh. 1 - Prob. 36RECh. 1 - Prob. 37RECh. 1 - Prob. 38RECh. 1 - Prob. 39RECh. 1 - Prob. 40RECh. 1 - Depreciation A business property can be...Ch. 1 - Marginal Profit A company has determined that its...
Knowledge Booster


Learn more about
Need a deep-dive on the concept behind this application? Look no further. Learn more about this topic, subject and related others by exploring similar questions and additional content below.Similar questions
- High School Graduates The following table shows the number, in millions, graduating from high school in the United States in the given year. Year Number graduating in millions 1985 2.83 1987 2.65 1989 2.47 1991 2.29 a. By calculating difference, show that these data can be modeled using a linear function. b. What is the slope for the linear function modeling high school graduations? Explain in practical terms the meaning of the slope. c. Find a formula for a linear function that models these data. d. Express, using functional notation, the number graduating from high school in 1994, and then use your formula from part c to calculate that value.arrow_forwardPrice of Amazons Kindle The following table shows the price of Amazons Kindle 2 e-book reader. It is adapted from data available on the web. Here time is measured in months since February 2009, when the Kindle was launched. Time Price 0 349 5 299 10 249 15 199 a. By calculating differences, show that these data can be modeled using a linear function. b. Find a linear formula that models these data. Be careful about the sign of the slope. c. What price does your formula from part b project for January 2012 35 months after the Kindle was launched? Note: The web data were the basis for speculation that some day the Kindle would be free.arrow_forward6. Tuition at American Private Universities The following table shows the average yearly tuition and required fees, in dollars, charged by four-year American private nonprofit universities in the school year ending in the given year. Date Average tuition 2012 27,870 2013 29,004 2014 30,138 2015 31,272 2016 32,406 a. Show that these data can be modeled by a linear function, and find its formula. b. Plot the data points and add the graph of the linear formula you found in part a. c. What prediction does this formula give for average tuition and fees at four-year American private nonprofit universities for the academic year ending in 2021?arrow_forward
- Tuition at American Public Universities This is a continuation of Exercise 6. The following table shows the average yearly in-state tuition and required fees, in dollars, charged by four-year American public universities in the school year ending in the given year. Date Average tuition 2012 8318 2013 8595 2014 8872 2015 9149 2016 9426 a. Show that these data can be modeled by a linear function, and find its formula. b. What is the slope for the linear function modeling tuition and required fees for public universities? c. What is the slope of the linear function modeling tuition and required fees for private universities? Note: See Exercise 6. d. Explain what the information in parts b and c tells you about the rate of increase in tuition in public versus private institutions. e. Which type of institution shows the larger percentage increase from 2015 to 2016? 6. Tuition at American Private Universities The following table shows the average yearly tuition and required fees, in dollars, charged by four-year American private nonprofit universities in the school year ending in the given year. Date Average tuition 2012 27, 870 2013 29, 004 2014 30, 138 2015 31, 272 2016 32, 406 a. Show that these data can be modeled by a linear function, and find its formula. b. Plot the data points and add the graph of the linear formula you found in part a. c. What prediction does this formula give for average tuition and fees at four-year American private nonprofit universities for the academic year ending in 2021?arrow_forwardDemand for Soft Drinks A convenience stores manager notices that sales of soft drinks are higher on hotter days, so he assembles the data in the table. a Make a scatter plot of the data. b Find and graph a linear function that models the data. c Use the model to predict soft drink sales if the temperature is 95. High temperature Number of cans sold 55 340 58 335 64 410 68 460 70 450 75 610 80 735 84 780arrow_forwardDemand for Soft Drinks A convenience store manager notices that sales of soft drink are higher on hotter days, so he assembles the data in the table. (a) Make a scatter plot of the data. (b) Find and graph a linear function that models the data. (c) Use the model to predict soft drink sales if the temperature is 95Farrow_forward
- Sales Barnes & Noble had annual sales of $6.8 billion in 2013 and $6.1 billion in 2015. Use the Midpoint Formula to estimate the sales in 2014. Assume that the annual sales followed a linear pattern.arrow_forwardDemand for Candy Bars In this problem you will determine a linear demand equation that describes the demand for candy bars in your class. Survey your classmates to determine what price they would be willing to pay for a candy bar. Your survey form might look like the sample to the left. a Make a table of the number of respondents who answered yes at each price level. b Make a scatter plot of your data. c Find and graph the regression line y=mp+b, which gives the number of respondents y who would buy a candy bar if the price were p cents. This is the demand equation. Why is the slope m negative? d What is the p-intercept of the demand equation? What does this intercept tell you about pricing candy bars? Would you buy a candy bar from the vending machine in the hallway if the price is as indicated. Price Yes or No 50 75 1.00 1.25 1.50 1.75 2.00arrow_forwardNeurology The average weight of a male child’s brain is 970 grams at age 1 and 1270 grams at age 3. (a) Assuming that the relationship between brain weight y and age t is linear, write a linear model for the data. (b) What is the slope and what does it tell you about brain weight? (c) Use your model to estimate the average brain weight at age 2. (d) Use your school’s library, the Internet, or some other reference source to find the actual average brain weight at age 2. How close was your estimate? (e) (d) Do you think your model could be used to determine the average brain weight of an adult? Explain.arrow_forward
arrow_back_ios
arrow_forward_ios
Recommended textbooks for you
 Functions and Change: A Modeling Approach to Coll...AlgebraISBN:9781337111348Author:Bruce Crauder, Benny Evans, Alan NoellPublisher:Cengage Learning
 Algebra and Trigonometry (MindTap Course List)AlgebraISBN:9781305071742Author:James Stewart, Lothar Redlin, Saleem WatsonPublisher:Cengage Learning
 Algebra & Trigonometry with Analytic GeometryAlgebraISBN:9781133382119Author:SwokowskiPublisher:Cengage
 Trigonometry (MindTap Course List)TrigonometryISBN:9781337278461Author:Ron LarsonPublisher:Cengage Learning
 College AlgebraAlgebraISBN:9781305115545Author:James Stewart, Lothar Redlin, Saleem WatsonPublisher:Cengage Learning
Functions and Change: A Modeling Approach to Coll...
Algebra
ISBN:9781337111348
Author:Bruce Crauder, Benny Evans, Alan Noell
Publisher:Cengage Learning
Algebra and Trigonometry (MindTap Course List)
Algebra
ISBN:9781305071742
Author:James Stewart, Lothar Redlin, Saleem Watson
Publisher:Cengage Learning
Algebra & Trigonometry with Analytic Geometry
Algebra
ISBN:9781133382119
Author:Swokowski
Publisher:Cengage
Trigonometry (MindTap Course List)
Trigonometry
ISBN:9781337278461
Author:Ron Larson
Publisher:Cengage Learning
College Algebra
Algebra
ISBN:9781305115545
Author:James Stewart, Lothar Redlin, Saleem Watson
Publisher:Cengage Learning
Time Series Analysis Theory & Uni-variate Forecasting Techniques; Author: Analytics University;https://www.youtube.com/watch?v=_X5q9FYLGxM;License: Standard YouTube License, CC-BY
Operations management 101: Time-series, forecasting introduction; Author: Brandoz Foltz;https://www.youtube.com/watch?v=EaqZP36ool8;License: Standard YouTube License, CC-BY