
BASIC BUSINESS STAT LL W/MYLAB
14th Edition
ISBN: 9780135991459
Author: BERENSON
Publisher: PEARSON
expand_more
expand_more
format_list_bulleted
Concept explainers
Videos
Textbook Question
Chapter 14, Problem 9PS
The following ANOVA summary table is for a multiple regression model with two independent variables:
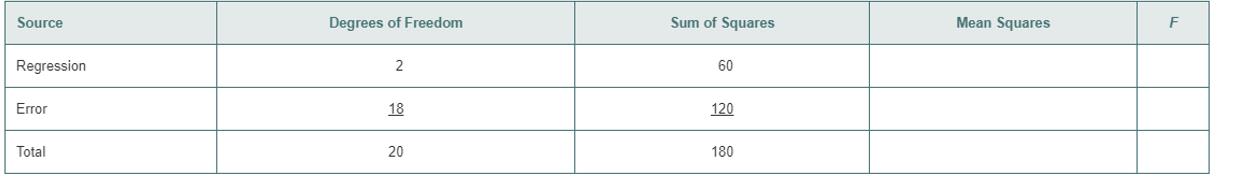
a. Determine the regression
b. Compute the overall
c. Determine whether there is a significant relationship between
d. Compute the coefficient of multiple determination,
e. compute the adjusted
Expert Solution & Answer
Want to see the full answer?
Check out a sample textbook solution
Students have asked these similar questions
Suppose you estimated the relationship between the exam scores and class sizes.
score^ = b0 + b1*Size + e^
Based on the OLS estimate, you obtain the following standard errors and parameter estimates:
b0= 95; se(b0) = 30 ; b1= −1.2; se(b1 ) = 0.4 ; n = 25
a) What kind of relationship exist between the exam scores and the clas sizes? Interpret the regression.
b) Conduct the following hypothesis test at the 1% significance level:
H0 : b1 ≥ 0
H1 : b1 < 0
In your answer draw the distribution of the test statistic that you use, and clearly define the rejection region(s), indicating the critical value(s).
In order to determine a realistic price for a new product that a company wants to market the company’s research department selected 10 sites thought to have essentially identical sales potential and offered the product in each at a different price. The resulting sales are recorded in the accompanying table:
Price ($)
Sales ($1,000s)
15.00
15
15.50
14
16.00
16
16.50
9
17.00
12
17.50
10
18.00
8
18.50
9
19.00
6
19.50
5
c). Find the equation of the sample regression line using Minitab.
d). Interpret the meaning of the coefficients of the equation of the sample regression line.
Sarah is the office manager for a group of financial advisors who provide financial services forindividual clients. She would like to investigate whether a relationship exists between the numberof presentations made to prospective clients in a month and the number of new clients per month.The following table shows the number of presentations and corresponding new clients for aa random sample of six employees.Employee Presentations New Clients1 7 22 9 33 9 44 10 35 11 56 12 3Sarah would like to use simple regression analysis to estimate the number of new clients permonth based on the number of presentations made by the employee per month. The test statisticfor testing the hypothesis that the population coefficient of determination is greater than zero is________.
A) 1.03
B) 1.45
C) -1.16
D) 0.35
Chapter 14 Solutions
BASIC BUSINESS STAT LL W/MYLAB
Ch. 14 - For this problem, use the following multiple...Ch. 14 - For this problem, use the following multiple...Ch. 14 - A nonprofit analyst seeks to determine which...Ch. 14 - Profitability remains a challenge for banks and...Ch. 14 - The production of wine is a multibillion-dollar...Ch. 14 - Human resource managers face the business problem...Ch. 14 - Prob. 7PSCh. 14 - Prob. 8PSCh. 14 - The following ANOVA summary table is for a...Ch. 14 - The following ANOVA summary table is for a...
Ch. 14 - A financial analyst engaged in business valuation...Ch. 14 - In Problem 14.3 on page 541, you predicted...Ch. 14 - In Problem 14.5 on page 542, you used the...Ch. 14 - In Problem 14.4 on page 541, you used efficiency...Ch. 14 - In Problem 14.7 on page 542, you used the weekly...Ch. 14 - Prob. 16PSCh. 14 - Prob. 17PSCh. 14 - Prob. 18PSCh. 14 - In Problem 14.5 on page 542, you used the...Ch. 14 - Prob. 20PSCh. 14 - Prob. 21PSCh. 14 - Prob. 22PSCh. 14 - Prob. 23PSCh. 14 - Prob. 24PSCh. 14 - In Problem 14.3 on page 541, you predicted...Ch. 14 - In Problem on page 541, you used efficiency ratio...Ch. 14 - Prob. 27PSCh. 14 - In Problem 14.6 on page 542, you used full-time...Ch. 14 - Prob. 29PSCh. 14 - Prob. 30PSCh. 14 - The following is the ANOVA summary table for a...Ch. 14 - The following is the ANOVA summary table for a...Ch. 14 - In Problem 14.5 on page 542, you used alcohol...Ch. 14 - In Problem 14.4 on page 541, you used efficiency...Ch. 14 - Prob. 35PSCh. 14 - In Problem 14.6 on page 542, you used full-time...Ch. 14 - Prob. 37PSCh. 14 - Suppose X1 is a numerical variable and X2 is a...Ch. 14 - The chair of the accounting department plans to...Ch. 14 - A real estate association in a suburban community...Ch. 14 - In Problem 14.5 on page 542, you developed a...Ch. 14 - In mining engineering, holes are often drilled...Ch. 14 - The owner of a moving company typically has his...Ch. 14 - Prob. 44PSCh. 14 - Zagat’s publishes restaurant rating for various...Ch. 14 - In Problem 14.6 on page 542, you used full-time...Ch. 14 - In Problem 14.5 on page 542, the percentage of...Ch. 14 - Prob. 48PSCh. 14 - The director of a training program for a large...Ch. 14 - Prob. 50PSCh. 14 - Prob. 51PSCh. 14 - Prob. 52PSCh. 14 - Prob. 53PSCh. 14 - Prob. 54PSCh. 14 - Prob. 55PSCh. 14 - Prob. 56PSCh. 14 - Prob. 57PSCh. 14 - An automotive insurance company wants to predict...Ch. 14 - A marketing manager wants to predict customer with...Ch. 14 - A local supermarket manager wants to use two...Ch. 14 - Prob. 61PSCh. 14 - Prob. 62PSCh. 14 - Prob. 63PSCh. 14 - Prob. 64PSCh. 14 - Prob. 65PSCh. 14 - Prob. 66PSCh. 14 - Prob. 67PSCh. 14 - Prob. 68PSCh. 14 - Prob. 69PSCh. 14 - Prob. 70PSCh. 14 - Prob. 71PSCh. 14 - The owner of a moving company typically has his...Ch. 14 - Professional basketball has truly become a sport...Ch. 14 - A sample of 61 house recently listed for sale in...Ch. 14 - Measuring the height of a California redwood tree...Ch. 14 - A sample of 61 houses recently listed for sale in...Ch. 14 - Prob. 77PSCh. 14 - Referring to Problem 14.77, Suppose that an...Ch. 14 - Prob. 79PSCh. 14 - Prob. 80PSCh. 14 - Prob. 81PSCh. 14 - Prob. 82PSCh. 14 - Prob. 83PS
Knowledge Booster


Learn more about
Need a deep-dive on the concept behind this application? Look no further. Learn more about this topic, statistics and related others by exploring similar questions and additional content below.Similar questions
- Based on the ANOVA table given, is there enough evidence at the 0.050.05 level of significance to conclude that the linear relationship between the independent variables and the dependent variable is statistically significant? ANOVA Source df SS MS F Significance F Regression 3 212.987150 70.995717 1.092713 0.448523 Residual 4 259.887850 64.971963 Total 7 472.875000arrow_forwardSuppose that a sample of n = 12 pairs of X and Y scores has SSY = 90 and a Pearson correlation of r = +0.40. Does the regression equation predict a significant portion of the variance? Test with α = .05.(hint: SStotal = SSY; r2 = SSregression/SSTotal)arrow_forwardThe following data are the monthly salaries and the grade point averages for students who obtained a bachelor's degree in business administration. GPA Monthly Salary ($) 2.6 3,600 3.4 3,900 3.6 4,300 3.2 3,800 3.5 4,200 2.9 3,900 The estimated regression equation for these data is and . Use Table 1 of Appendix B. a. Develop a point estimate of the starting salary for a student with a GPA of (to 1 decimal). b. Develop a confidence interval for the mean starting salary for all students with a GPA (to 2 decimals). ( , ) c. Develop a prediction interval for Ryan Dailey, a student with a GPA of (to 2 decimals). ( , ) d. Discuss the differences in your answers to parts (b) and (c).arrow_forward
- Consider the following ANOVA table for a multiple regression model relating housing prices (in thousands of dollars) to the number of bedrooms in the house and the size of the lot on which the house was built (in square feet). There were 9090 total observations. Estimated Price=20,160.07+2188.83(Bedrooms)+0.2139(Lot Size)Estimated Price=20,160.07+2188.83(Bedrooms)+0.2139(Lot Size) ANOVA dfdf SSSS MSMS F� Significance F� Regression 22 306,443.7975306,443.7975 153,221.8988153,221.8988 21.727421.7274 2.2211E-082.2211E-08 Residual 8787 613,525.5190613,525.5190 7052.01757052.0175 Total 8989 919,969.3165919,969.3165 What percent of variation in housing prices is explained by the number of bedrooms and lot size? Round your answer to two decimal placesarrow_forwardConsider the following ANOVA table for a multiple regression model relating housing prices (in thousands of dollars) to the number of bedrooms in the house and the size of the lot on which the house was built (in square feet). There were 7575 total observations. Estimated Price=25,356.83+2776.31(Bedrooms)+0.2478(Lot Size)Estimated Price=25,356.83+2776.31(Bedrooms)+0.2478(Lot Size) ANOVA dfdf SSSS MSMS F� Significance F� Regression 22 302,698.1946302,698.1946 151,349.0973151,349.0973 16.033416.0334 1.7407E-061.7407E-06 Residual 7272 679,651.5550679,651.5550 9439.60499439.6049 Total 7474 982,349.7496982,349.7496 Compute the adjusted coefficient of determination for this regression model. Round your answer to four decimal places.arrow_forwardGiven below are seven observations collected in a regression study on two variables, x (independent variable) and y (dependent variable). Copy and paste the numbers in an Excel worksheet and then use Excel's Regression tool to conduct a simple linear regression analysis. Choose 95% confidence level. Answer the following questions: x y 2 12 3 9 6 8 7 7 8 6 7 5 9 2 t statistics is statistically significant at 5% level. Answer Yes or No. Yes No What is the lower bound of the 95% confidence interval for the independent variable x (Keep 2 decimal places) What is the upper bound of the 95% confidence interval for the independent variable x (Keep 2 decimal places)arrow_forward
- A sample of n = 120 scores were presented using the Tenacity (authority) scores to the following predictors: age gender, SES, tone of voice, and clothing. Using a two-tailed test at the 0.05 level of significance, a multiple regression analysis was computed: 1. tenacity and age (pvalue = 0.043); 2. tenacity and gender (pvalue = 0.102); 3. tenacity and SES (pvalue = 0.40); 4. tenacity and voice (pvalue = 0.001); 5. tenacity and clothing (value = 0.017); SOrs Using the pvalue, provide your DECISION, whether:Accept Ho or Reject Ho, Accept Haarrow_forwardUse the following ANOVA table for regression to answer the questions. Analysis of Variance Source DF SS MS F P Regression 1 3401.4 3401.4 19.6 0.000 Residual Error 174 30189.0 173.5 Total 175 33590.4 Give the F-statistic and p-value.arrow_forwardGiven below are seven observations collected in a regression study on two variables, x (independent variable) and y (dependent variable). Copy and paste the numbers in an Excel worksheet and then use Excel's Regression tool to conduct a simple linear regression analysis. Choose 95% confidence level. Answer the following questions: x y 2 12 3 9 6 8 7 7 8 6 7 5 9 2 Find out regression coefficient b1 (Keep 2 decimal places) Find out SSR (Keep 2 decimal places) Find out SST (Only report the integer part)arrow_forward
- consider the coefficient estimates of the following market model linear regression of general motors (gm) on the S&P500 market returns coefficient estimate std error tvalue pr(>ItI) intercept 0.005860 0.0003704 1.582 0.12412 sp500 0.0904753 0.266702 3.392 0.00196 The number of observations is 32.At the 1% significance level, what is the (1)test statistic value,(2) the critical values (3) decision regarding the null hypothesis that the beta coefficient on the market returns is equal to 1.61arrow_forwardUse the following ANOVA table for regression to answer the questions. Analysis of Variance Source DF SS MS F P Regression 1 3375.0 3375.0 20.5 0.000 Residual Error 174 28640.4 164.6 Total 175 32015.4 The -statistic is _________________.The -value is ____________________. Choose the conclusion of this test using a 5% significance level. -Reject H0. The model is not effective. -Do not reject . We did not find evidence that the model is not effective. -Reject H0. The model is effective. -Do not reject . We did not find evidence that the model is effective.arrow_forward
arrow_back_ios
arrow_forward_ios
Recommended textbooks for you
 Glencoe Algebra 1, Student Edition, 9780079039897...AlgebraISBN:9780079039897Author:CarterPublisher:McGraw Hill
Glencoe Algebra 1, Student Edition, 9780079039897...
Algebra
ISBN:9780079039897
Author:Carter
Publisher:McGraw Hill
Mod-01 Lec-01 Discrete probability distributions (Part 1); Author: nptelhrd;https://www.youtube.com/watch?v=6x1pL9Yov1k;License: Standard YouTube License, CC-BY
Discrete Probability Distributions; Author: Learn Something;https://www.youtube.com/watch?v=m9U4UelWLFs;License: Standard YouTube License, CC-BY
Probability Distribution Functions (PMF, PDF, CDF); Author: zedstatistics;https://www.youtube.com/watch?v=YXLVjCKVP7U;License: Standard YouTube License, CC-BY
Discrete Distributions: Binomial, Poisson and Hypergeometric | Statistics for Data Science; Author: Dr. Bharatendra Rai;https://www.youtube.com/watch?v=lHhyy4JMigg;License: Standard Youtube License