
(a)
Equation that relate planned spending to output and real rate of interest.
(a)
Explanation of Solution
The planned aggregate expenditure is the sum of consumption, planned investment, government spending, and net export. The equation that connects the planned spending to output and real rate interest can be derived as follows:
Thus, the equation for PAE is derived as
(b)
Construction of a table shows the relation of equilibrium output in the short run and inflation rate.
(b)
Explanation of Solution
The equation for PAE is derived as
Thus, the autonomous expenditure is 4,890.
The equilibrium output in the short run can be calculate by fix PAE equal to the output (Y). When the inflation rate is 0.0 and rate of interest is 0.02, Y is calculated by substituting the equation
Thus, the equilibrium output in the short run is 12,225.
Similarly, substitute each values of the rate of interest in the equation
Table 1
| Rate of inflation | Real inflation rate | Autonomous expenditure | Equilibrium output |
| 0 | 0.02 | 4,890 | 12,225 |
| 0.01 | 0.03 | 4,860 | 12,150 |
| 0.02 | 0.04 | 4,830 | 12,075 |
| 0.03 | 0.05 | 4,800 | 12,000 |
| 0.04 | 0.06 | 4,770 | 11,925 |
With the equilibrium output, the aggregate demand curve is graphically represented as below:
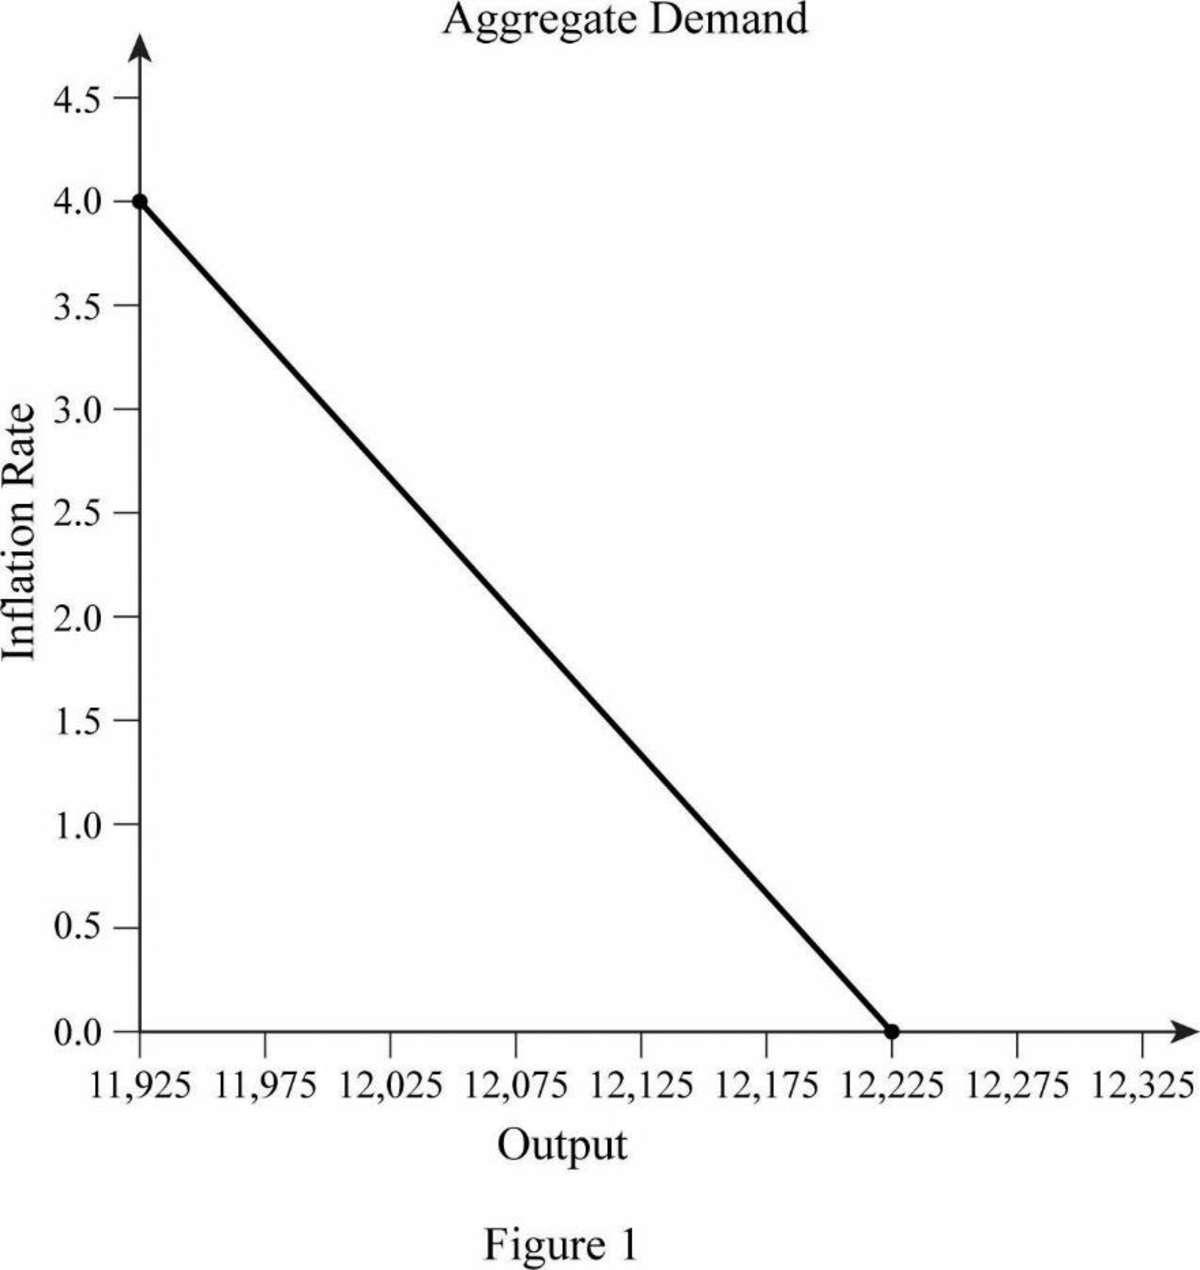
In Figure 1, the horizontal axis represents output and the vertical axis represents the rate of inflation. Curve AD is the aggregate demand curve, which refers to the total value of the goods and services that are demanded at each price or inflation rate in a given period of time.
(c)
Impact of increasing government purchases and construction of a table shows the relation of equilibrium output in the short run and inflation rate.
(c)
Explanation of Solution
The planned aggregate expenditure is the sum of consumption, planned investment, government spending, and net export. The equation that connects the planned spending to output and real rate interest is derived as follows:
Thus, the equation for PAE is derived as
Thus, the autonomous expenditure is 4,990.
The equilibrium output in the short run is calculated by fix PAE equal to the output (Y). When the inflation rate is 0.0 and rate of interest is 0.02, Y is calculated by substituting equation
Thus, the equilibrium output in the short run is 12,475.
Similarly, substitute each values of the rate of interest in the equation
Table 1
| Inflation Rate | Real Interest Rate | Autonomous Expenditure | Equilibrium Output |
| 0 | 0.02 | 4,990 | 12,475 |
| 0.01 | 0.03 | 4,960 | 12,400 |
| 0.02 | 0.04 | 4,930 | 12,325 |
| 0.03 | 0.05 | 4,900 | 12,250 |
| 0.04 | 0.06 | 4,870 | 12,175 |
With the equilibrium output, the aggregate demand curve is graphically represented as below:
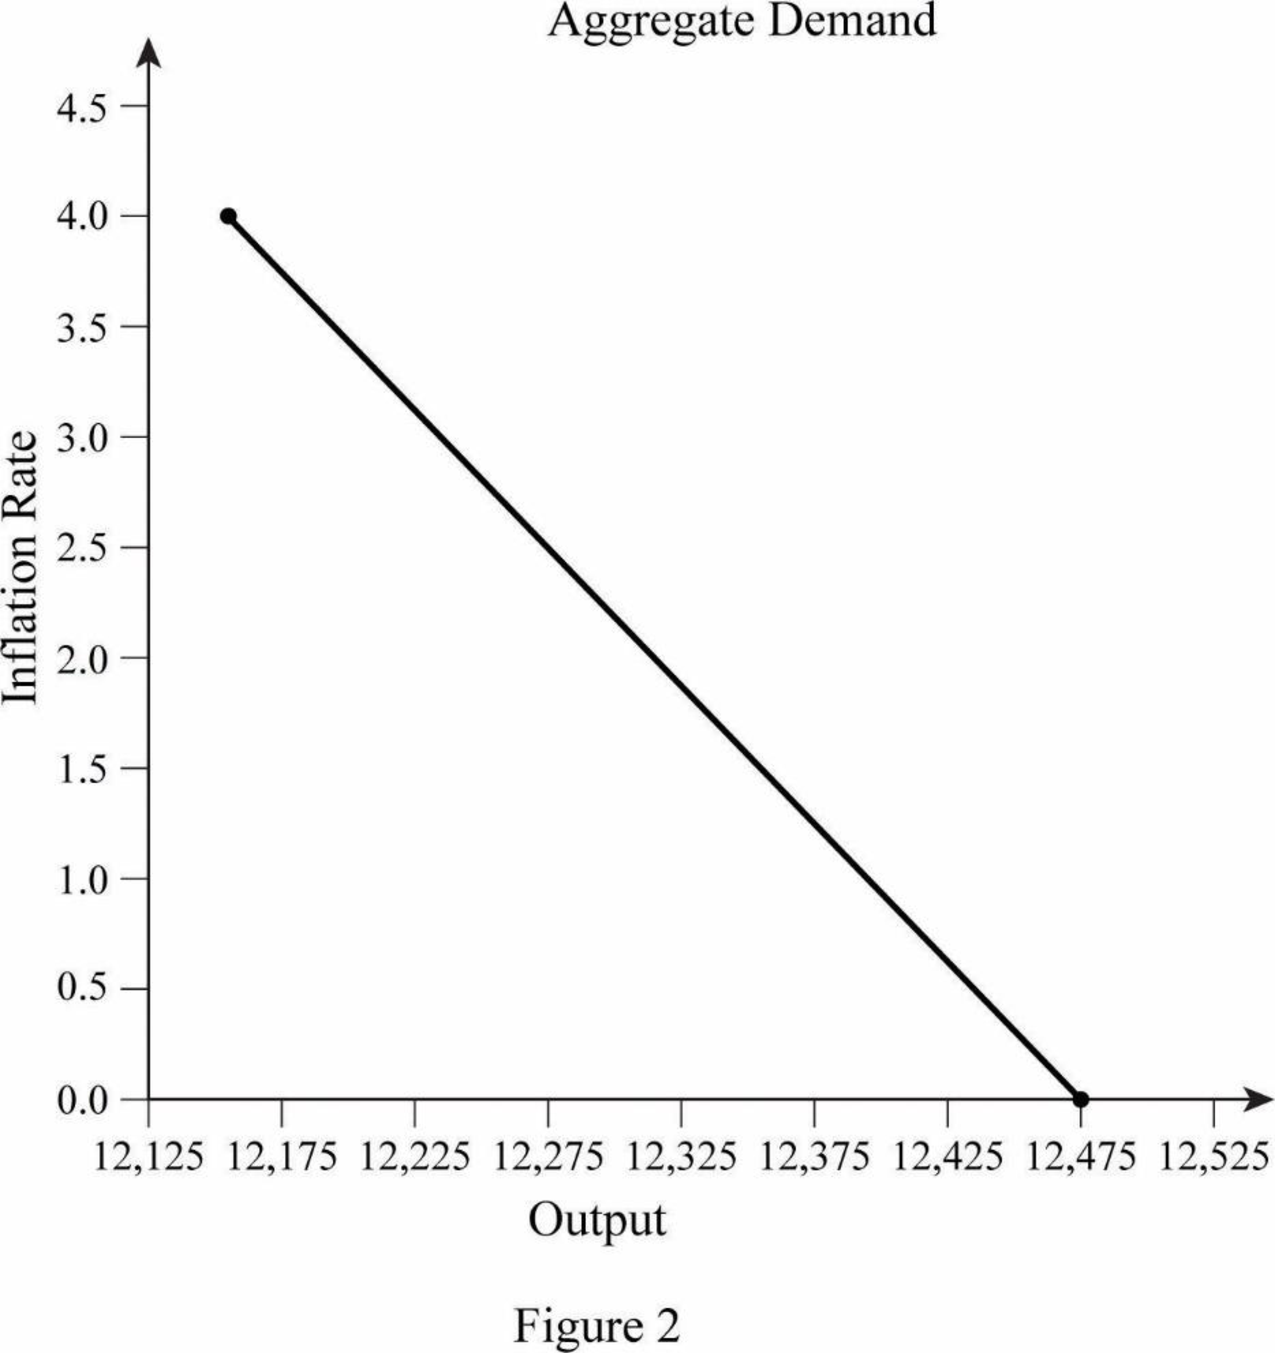
In Figure 2, the horizontal axis represents output and the vertical axis represents the rate of inflation. Curve AD is the aggregate demand curve, which refers to the total value of the goods and services that are demanded at each price or inflation rate in a given period of time.
Want to see more full solutions like this?
Chapter 15 Solutions
PRINCIPLES OF MACROECON.(LL)-W/ACCESS

- Which of the following will NOT lead to an increase in real GDP? A. On average, people in a country decide to increase the number of hours they work by 5%. B. Spending on homeland security increases in response to a terrorist attack. C. The price level and nominal GDP increase by 10%. D. Due to lower interest rates by the Fed investors increase their investmenarrow_forwardUsing a suitable graph, what is the effect on national income if people increase autonomous saving?arrow_forwardBased on the data in the table and graph below, identify the equilibrium GDP: Price Level Real GDP/Output in $ billion Real GDP/Spending in $ billion 80 100 180 90 120 160 100 140 140 110 160 125 120 170 115 130 175 105 140 178 100arrow_forward
- Identify the point or points for which the following is true: The economy cannot reach this point without an increase in resources or improvement in technologyarrow_forwardBased on the data in the table and graph below, identify the equilibrium GDP: Price Level Real GDP/Output in $ billion Real GDP/Spending in $ billion 80 100 180 90 120 160 100 140 140 110 160 125 120 170 115 130 175 105 140 178 100 Group of answer choices $160 billion $100 billion $140 billion $40 billionarrow_forwardOut of the options below, which is the best answer for a complete analysis of economic conditions? GDP: +1.2 Consumption: +0.1% Investment: +3.0% Government Expenditures: +0.5% Net Exports = Unchanged a. Consumer spending is down but consumer investing is up. I expect the stock market to be reaching new highs b. While GDP growth is slow, the future is bright because firms are investing in new plant and equipment a. The economy is doing well at 1.2% growth. d. GDP is growing but with flat consumption, increased investment is likely due to inventory increases. This is a bad sign for the economy now and perhaps next quarter.arrow_forward
- Using the circular flow model, explain what might happen to the level of income of an economy if it experiences an increase in exports and an increase in taxes.arrow_forwardReduction in government expenditure A) has no impact on planned investment B) will lead to a decrease in planned investment due to increasing interest rate C) Can lead to an increase in planned investment due to increasing interest rate D) will not be productive for the economyarrow_forwardInvestment is driven by all of the following except ____________.arrow_forward
- Natural rate of output is equal to the amount of real GDP when the economy is at the: a) Natural rate of net exports b) Natural rate of investments c) Natural rate of unemployment d) None of the abovearrow_forwardBased on this definition, indicate which of the transactions in the following table will be included in (that is, directly increase) the GDP of the United States in 2019.arrow_forwardA. Net export spending will have a negative value when the country exports more goods than it imports from other countries. Group of answer choices True False B. Which of the following components of GDP includes your tuition payments? Group of answer choices consumption of nondurable goods investment consumption of durable goods consumption of services C. In the economy, income earned when producing new final goods and services must equal expenditure on the new final goods and services. Group of answer choices True Falsearrow_forward

 Economics (MindTap Course List)EconomicsISBN:9781337617383Author:Roger A. ArnoldPublisher:Cengage Learning