
Videos
(a)
Construction of a table that shows the relation of equilibrium output in the short run and inflation rate.
(a)
Explanation of Solution
The planned aggregate expenditure is the sum of consumption, planned investment, government spending, and net export. The equation that connects the planned spending to output and real rate interest can be derived as follows:
Thus, the equation for PAE is derived as
Thus, the autonomous expenditure is 4,830.
The equilibrium output in the short run can be calculated by fixing PAE, which is equal to the output (Y). The equilibrium output (Y) can be calculated by substituting the equation
Thus, the equilibrium output in the short run is 12,075.
Similarly, substitute each value of the rate of interest in the equation
Table 1
| Rate of inflation | Real inflation rate | Autonomous expenditure | Equilibrium output |
| 0 | 0.04 | 4,830 | 12,075 |
| 0.01 | 0.045 | 4,815 | 12,038 |
| 0.02 | 0.05 | 4,800 | 12,000 |
| 0.03 | 0.055 | 4,785 | 11,963 |
| 0.04 | 0.06 | 4,770 | 11,925 |
With the equilibrium output, the aggregate demand curve is graphically represented below:
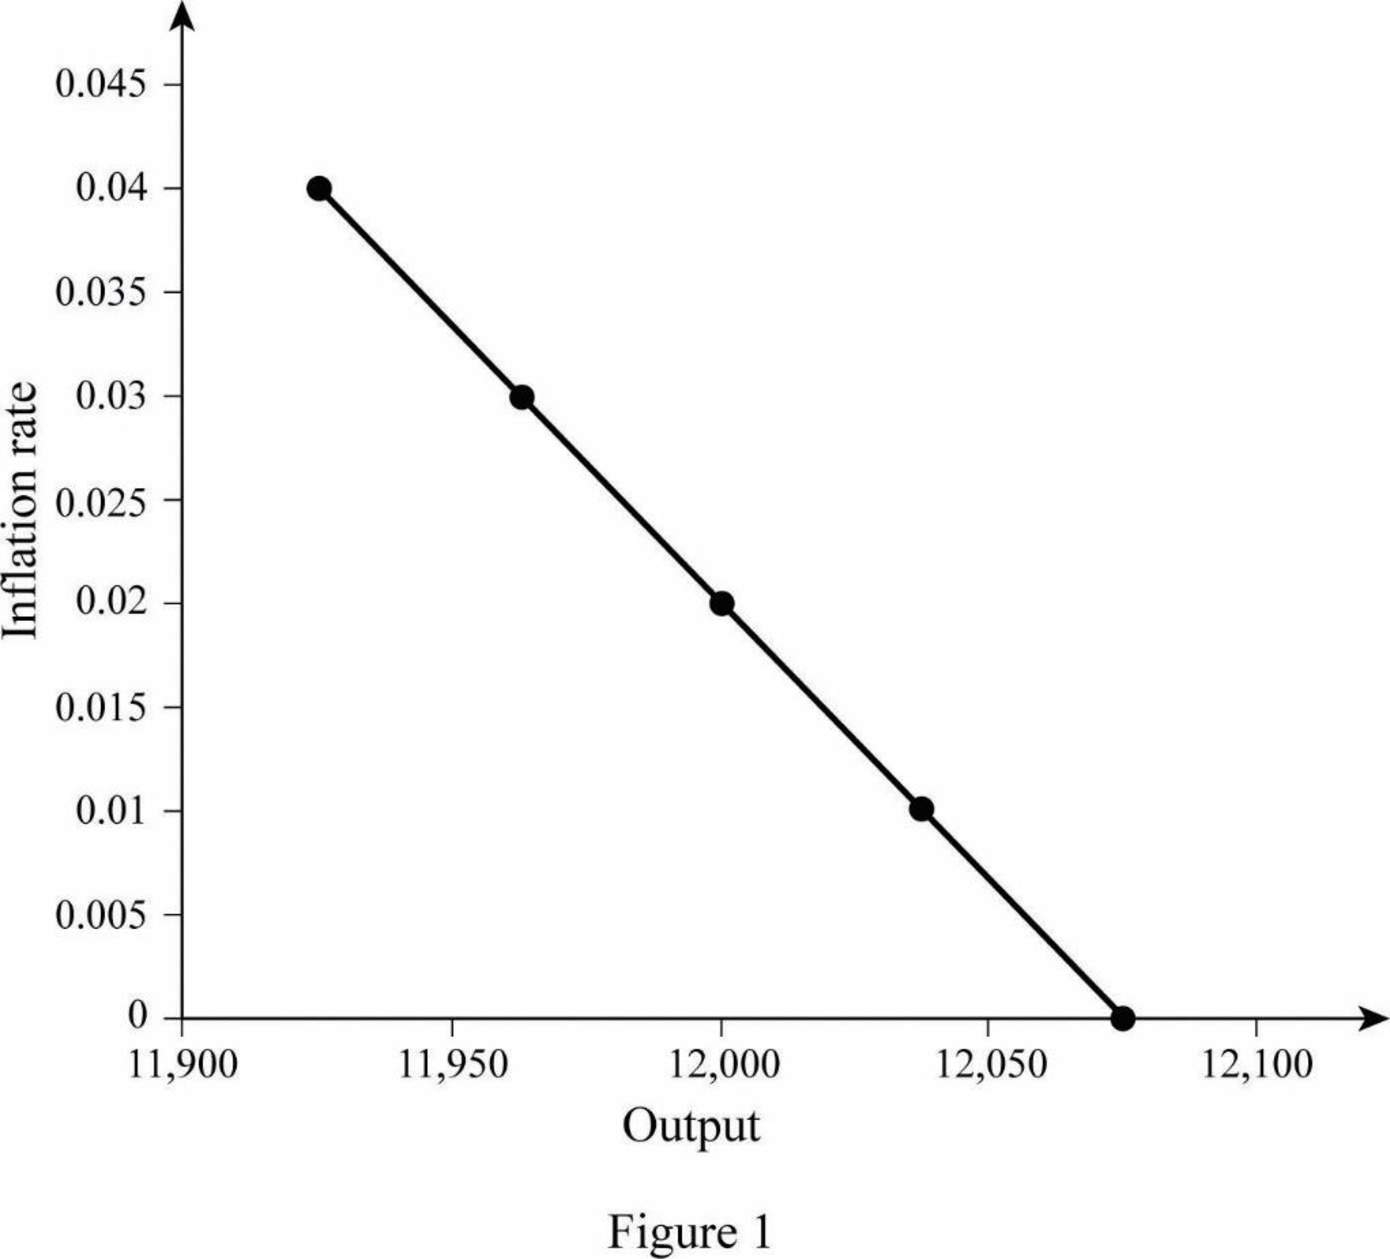
In Figure 1, the horizontal axis represents the output, and the vertical axis represents the rate of inflation. The curve AD is the aggregate demand curve, which refers to the total value of the goods and services that are demanded at each price or inflation rate in a given period of time.
(b)
Construction of a table that shows the relation of equilibrium output in the short run and inflation rate when the Fed reduces the real rate of interest.
(b)
Explanation of Solution
The equation for PAE is derived as
Thus, the autonomous expenditure is 4,845.
The equilibrium output in the short run can be calculated by fixing PAE, which is equal to the output (Y). The equilibrium output (Y) can be calculated by substituting the equation
Thus, the equilibrium output in the short run is around 12,113.
Similarly, substitute each value of rate of interest in the equation
Table 2
| Rate of inflation | Real inflation rate | Autonomous expenditure | Equilibrium output |
| 0 | 0.035 | 4,845 | 12,113 |
| 0.01 | 0.04 | 4,830 | 12,075 |
| 0.02 | 0.045 | 4,815 | 12,038 |
| 0.03 | 0.05 | 4,800 | 12,000 |
| 0.04 | 0.055 | 4,785 | 11,963 |
Table-2 shows the autonomous expenditure and equilibrium output at each level of inflation rate with a new real rate of interest. While comparing Tables 1 and 2, it is clear that the autonomous expenditure increases about 15 at each level of inflation rate. In the case of equilibrium output, it is increased about 38. This increase in aggregate demand will lead to a shift in the AD curve to the right because the Fed adopts easing of monetary policy, which means, the Fed reduced the real rate of interest and thereby cause a downward shift of reaction curve. As a result, AD curve shifts to the right.
Want to see more full solutions like this?
Chapter 15 Solutions
PRINC OF MACOECO W/CONNECT CODE


- Consider the AD/AS model with a constant inflation rate. It is possible that the money supply is rising while interest rates are unchanged because... a. Declining interest rates cause the investment demand curve to shift to the left, which causes interest rates to rise back to their original level. b. The rising price level increases money demand, offsetting the impact of the rising money supply. c. The rising price level decreases money demand which pushes up interest rates. d. Declining interest rates cause the investment demand curve to shift to the right, which causes interest rates to rise back to their original leve. e. The money transmission mechanism does not apply in a situation of sustained inflation.arrow_forwardComplete the following table to compare the results of an unanticipated expansionary policy to those of an anticipated expansionary policy in the short run and long run. Determine whether, in the short run, the level of output increases, decreases, or remains unchanged relative to the potential output level when the expansionary policy is anticipated versus unanticipated. Additionally, determine whether, in the long run, the actual price level is above, below, or the same as initial expectations under both scenarios, and, again, determine whether the level of output increases, decreases, or remains unchanged. Anticipated Expansionary Policy Unanticipated Expansionary Policy Short-Run Change in Output Decrease/Increase* Decrease/Increase/No Change* Long-Run Change in Price Level Same as Initial expectation/Higher then initial expectations/ lower then initial expectations* (same options as box on the left) ** Long-Run Change in Output Decrease/Increase/No change*…arrow_forwardSuppose that, in an attempt to combat severe unemployment, the government decides to increase the amount of money in circulation in the economy. This monetary policy action ________(Decreases, Increases) demand for goods and services in the economy, leading to ________(Higher, Lower) prices for products. In the short run, the change in prices induces firms to produce ________(Fewer, morer) goods and services. This, in turn, leads to a ___________(Higher, Lower) unemployment level. Based on this analysis, the economy faces the following trade-off between inflation and unemployment: Higher inflation leads to _________(Higher, Lower) unemployment.arrow_forward
- After staying virtually flat for about a year and a half, the average lending rate of banks has started to show signs of decline in April after the Bank of Ghana reduced the monetary policy rate the month before. The Summary of Economic and Financial Data (May 2020) published by the Bank of Ghana has shown that average lending rate has finally moved out of its comfort zone to a step downward. Prior to recording 22.38 percent in April, the average lending rate has since the past 17 months (December 2018) not come below 23%.How would banks benefit when interest rates decrease?arrow_forwardWhich of the following statements about the debate over stabilization policy are correct? Check all that apply. Advocates of active stabilization policy believe that the government can adjust monetary and fiscal policy to counteract waves of excessive optimism and pessimism among consumers and businesses. Opponents of active stabilization policy believe that significant time lags in both fiscal and monetary policy often exacerbate economic fluctuations. Opponents of active stabilization believe that active fiscal and monetary policies have no effect on aggregate demand. Advocates of active stabilization believe that implementation lags for fiscal and monetary policy do not exist.arrow_forwardIn the basic New Keynesian model, if the central bank is initially achieving its goals, and the natural rate of interest rises, the central bank should A. increase the nominal interest rate by the amount of the natural real interest rate increase. B. reduce the nominal interest rate by the amount of the natural real interest rate increase. C. increase the nominal interest rate by less than the amount of the natural real rate of interest increase. D. reduce the nominal interest rate by less than the amount of the natural real interest rate increase. E. do nothingarrow_forward
- Continuing to work with a 2% inflation target, a 1999 version of the Taylor Rule and an initial nominal policy rate of 1.5%, now consider the impact of including a variable risk premium that is typically positive, meaning that the market interest rate is usually above the central bank policy rate. In the following questions, assume the normal (natural) risk premium is 100bp, the economy has a negative output gap (minus 1%), the actual risk premium is 300bp, the economy’s natural real market interest rate is 2% and that both actual and expected inflation is 1%. 5a) what nominal policy rate would you recommend? 5b) what is the natural nominal policy interest rate? 5c) how does the new market real interest rate compare with its initial level? 5d) what nominal policy rate would the Taylor Rule recommend if the negative output gap then widened to minus 2% and both current and expected inflation fell to zero? (other factors, including the risk premium remaining unchanged)arrow_forwardIn the basic New Keynesian Model, in a liquidity trap where initially there is a positive output gap and inflation is lower than the inflation target, forward guidance is a promise by the central bank of A. lower future output than would otherwise be optimal for the central bank. B. lower current output. C. higher future inflation than would otherwise be optimal for the central bank. D. lower future inflation than would otherwise be optimal for the central bank. E. lower current inflation.arrow_forwardAssume that the housing market is in equilibrium in year 1. In year 2, the mortgage rate that banks charge consumers decreases, but producers are not affected. Also in year 2, the cost of lumber used to build homes decreases. Which of the following is most likely to be the equilibrium change? a The equilibrium will be at point C before the change in expectations and point B after the change b The equilibrium will be at point A before the change in expectations and point B after the change c The equilibrium will be at point A before the change in expectations and point E after the change d The equilibrium will be at point E before the change in expectations and point A after the changearrow_forward
- Assume the U.S. is a closed economy and that it is starting out in both SR and LR equilibrium. Assume that not all prices are sticky. The Fed has been raising interest rates the last few months and will likely continue to do so. One result of this is that home loan (mortgage) rates have shot up from < 3% to over 7%, sending house prices across the U.S. lower (on average). Banks are also seeing loan default rates increase (not just for home loans, but for all loans) and are being more cautious about the loans they make and are increasing the amount of money they set aside to handle the expected loan defaults. A. Using appropriate graph(s), show and explain the short-run impact(s) of the events described above on the U.S. economy. B. Using just an AD/AS graph (and starting from your result in A), show and explain what happens in the long run. Put your new graph and explanation belowarrow_forwardAccording to modern Keynesian theory, an increase in the money supply will reduce interest rates and increase aggregate demand without unintended consequences. reduce interest rates and decrease aggregate demand without unintended consequences. increase interest rates and increase aggregate demand without unintended consequences. increase interest rates and decrease aggregate demand without unintended consequences.arrow_forwardThe economy of Pakistan has faced both a supply demand shock in the first quarter of 2020. Using the AS/AD model explain how you expect the economy to behave in the short and long run. How does the decision to reduce the policy rate impact the economy. Explain using the ISLM model focusing on impacts on the goods and services market and the financial market.arrow_forward


