
Concept explainers
Videos
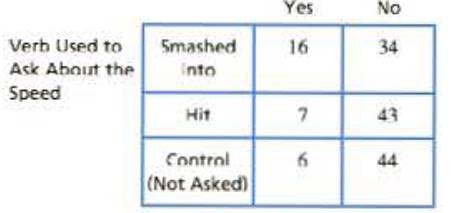
In a classic study, Loftus and Palmer (1974) investigated the relationship between memory for eyewitnesses and the questions they are asked. In the study, participants watched a film of an automobile accident and then were questioned about the accident. One group was asked how fast the cars were going when they "smashed into" each other. A second group was asked about the speed when the ears "hit" each other and a third group was not asked any question about the speed of the ears. A week later, the participants returned to answer additional questions about the accident, including whether they recalled seeing any broken glass. Although there was no broken glass in the film, several students claimed to remember seeing it. The following table shows the Frequency distribution of responses for each group.
- a. Does the proportion of participants who claim to remember broken glass differ significantly from group to group? Test with or α = .05
- b. Compute Cramér's V to measure the size of the treatment effect.
- c. Describe how the phrasing of the question influenced the participants' memories.
- d. Write a sentence demonstrating how the outcome of the hypothesis lest and the measure of effect size would be reported in a journal article
a.
To check: Whether the proportions of participants who claim to remember broken glass differ significantly from group to group for the given question.
Answer to Problem 13P
Explanation of Solution
Given info:
A sample of 150 students were involved in a study based on “the response they gave regarding the broken glass or verb used for speed”. The distribution is given in the question. Use
Calculations:
Step 1: Null Hypothesis and Alternate Hypothesis are:
Step 2: For the given sample, degrees of freedom equals:
With
Step 3:
The formula to calculate expected frequency is:
Substitute
For the category “smashed into”, the expected frequencies are:
For the category “Hit”, the expected frequencies are:
Similarly, for the category “control”, the expected frequencies are:
The observed and expected frequency is given below:
| Yes | No | Total | |
| Smashed into | 16 (9.66) | 34 (40.33) | 50 |
| Hit | 7 (9.66) | 43 (40.33) | 50 |
| Control (not asked) | 6 (9.66) | 44 (40.33) | 50 |
| Total | 29 | 121 | 150 |
Here the values within the braces are the expected frequencies.
Finally substitute the values in the
Step 4: Rejection rule:
Reject
Since
Step 5: Conclusion
Reject the null hypothesis and conclude that proportion of participants who claim to remember broken glass differ significantly from group to group.
b.
To find: The value of Cramer’s V to measure the size of the treatment effect.
Answer to Problem 13P
Explanation of Solution
Calculations:
The formula for Cramer’s V is:
Here,
Substitute 7.77 for
Hence, value of Cramer’s V is 0.227
c.
To describe: How does the phrasing of the question influence the participant’s memories.
Answer to Problem 13P
Explanation of Solution
Cramer’s V is used as post-test to determine strengths of association once the chi-square has determined significance. A value of 0.227 indicates a small effect. That is, a little association between the groups.
d.
Answer to Problem 13P
Explanation of Solution
The result showed that the proportion of participants who claim to remember broken glass differ significantly from group to group.
Want to see more full solutions like this?
Chapter 15 Solutions
Bundle: Essentials Of Statistics For The Behavioral Sciences, 9th + Aplia, 1 Term Printed Access Card


- Urban Travel Times Population of cities and driving times are related, as shown in the accompanying table, which shows the 1960 population N, in thousands, for several cities, together with the average time T, in minutes, sent by residents driving to work. City Population N Driving time T Los Angeles 6489 16.8 Pittsburgh 1804 12.6 Washington 1808 14.3 Hutchinson 38 6.1 Nashville 347 10.8 Tallahassee 48 7.3 An analysis of these data, along with data from 17 other cities in the United States and Canada, led to a power model of average driving time as a function of population. a Construct a power model of driving time in minutes as a function of population measured in thousands b Is average driving time in Pittsburgh more or less than would be expected from its population? c If you wish to move to a smaller city to reduce your average driving time to work by 25, how much smaller should the city be?arrow_forwardIn 1974, Loftus and Palmer conducted a classic study demonstrating how the language used to ask a question can influence eyewitness memory. In the study, college students watched a film of an automobile accident and then were asked questions about what they saw. One group was asked, “About how fast were the cars going when they smashed into each other?” Another group was asked the same question except the verb was changed to “hit” instead of “smashed into.” The “smashed into” the group reported significantly higher estimates of speed than the “hit” group. Suppose a researcher repeats this study with a sample of today’s college students and obtains the following results. Estimated SpeedSmashed Into Hitn = 16 n = 16M = 40.8 M = 34.0SS = 510 SS = 414 For this problem, complete the four stages of hypothesis testing to determine whether the assumption of homogeneity of variance is met. (Note: This problem is NOT asking you to conduct an independent-samples t-test.) Use a nondirectional…arrow_forwardIn 1974, Loftus and Palmer conducted a classic study demonstrating how the language used to ask a question can influence eyewitness memory. In the study, college students watched a film of an automobile accident and then were asked questions about what they saw. One group was asked, “About how fast were the cars going when they smashed into each other?” Another group was asked the same question except the verb was changed to “hit” instead of “smashed into.” The “smashed into” group reported significantly higher estimates of speed than the “hit” group. Suppose a researcher repeats this study with a sample of today’s college students and obtains the following results. “Smashed into” “Hit” n = 10 n = 15 M = 40.8 M = 34 S2= 57 S2= 30 Do the results indicate a significantly higher estimated speed for the “smashed into” group? Test at α = .01. If so, calculate Cohen’s D. Show all steps of hypothesis testing and all of your work. H0: H1: df: Critical value:…arrow_forward
 Glencoe Algebra 1, Student Edition, 9780079039897...AlgebraISBN:9780079039897Author:CarterPublisher:McGraw Hill
 Functions and Change: A Modeling Approach to Coll...AlgebraISBN:9781337111348Author:Bruce Crauder, Benny Evans, Alan NoellPublisher:Cengage Learning
 Holt Mcdougal Larson Pre-algebra: Student Edition...AlgebraISBN:9780547587776Author:HOLT MCDOUGALPublisher:HOLT MCDOUGAL
 Big Ideas Math A Bridge To Success Algebra 1: Stu...AlgebraISBN:9781680331141Author:HOUGHTON MIFFLIN HARCOURTPublisher:Houghton Mifflin Harcourt