
Concept explainers
Videos
a.
To check:whether the data present sufficient evidence to indicate a difference in the level of pollutants for the four different industrial plants.
a.
Answer to Problem 15.69SE
Yes.
Explanation of Solution
Given:
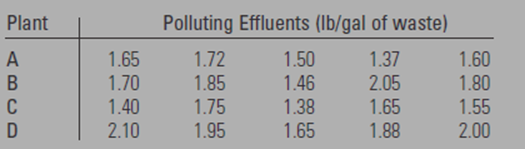
Five samples of liquid waste were taken at the output of each four industrial plants.
The data is shown in the given below table

Calculation:
Kruskal-Wallis test
The null hypothesis states that there is no difference between the population distribution. The alternatives hypothesis states the opposite of the null hypothesis.
Determine the rank of every data value. The smallest value receives the rank 1, the second smallest value receives the rank 2, the third smallest value receives the rank 3, and so on. If multiple data values have the same value, then their rank is the average of the corresponding ranks.
The signed rank is the sign of the difference added to the rank.
| Sample 1 | Rank | Sample 2 | Rank | Sample 3 | Rank | Sample 4 | Rank |
| 1.65 | 9 | 1.7 | 11 | 1.4 | 3 | 2.1 | 20 |
| 1.72 | 12 | 1.85 | 15 | 1.75 | 13 | 1.95 | 17 |
| 1.5 | 5 | 1.46 | 4 | 1.38 | 2 | 1.65 | 16 |
| 1.37 | 1 | 2.05 | 19 | 1.65 | 9 | 1.88 | 9 |
| 1.6 | 7 | 1.8 | 14 | 1.55 | 6 | 2 | 18 |
Determine the sum of the ranks for each treatment:
Determine the value of the Kruskal-Wallis test statistics:
The
If the
There is sufficient evidence to support the claim that there is a difference in a level of pollutants for the four industrial plants.
b.
To find:the approximate p-value for the test and interpret its value.
b.
Answer to Problem 15.69SE
Explanation of Solution
Given:
Five samples of liquid waste were taken at the output of each four industrial plants.
The data is shown in the given below table

Calculation:
Kruskal-Wallis test
The null hypothesis states that there is no difference between the population distribution. The alternatives hypothesis states the opposite of the null hypothesis.
Determine the rank of every data value. The smallest value receives the rank 1, the second smallest value receives the rank 2, the third smallest value receives the rank 3, and so on. If multiple data values have the same value, then their rank is the average of the corresponding ranks.
The signed rank is the sign of the difference added to the rank.
| Sample 1 | Rank | Sample 2 | Rank | Sample 3 | Rank | Sample 4 | Rank |
| 1.65 | 9 | 1.7 | 11 | 1.4 | 3 | 2.1 | 20 |
| 1.72 | 12 | 1.85 | 15 | 1.75 | 13 | 1.95 | 17 |
| 1.5 | 5 | 1.46 | 4 | 1.38 | 2 | 1.65 | 16 |
| 1.37 | 1 | 2.05 | 19 | 1.65 | 9 | 1.88 | 9 |
| 1.6 | 7 | 1.8 | 14 | 1.55 | 6 | 2 | 18 |
Determine the sum of the ranks for each treatment:
Determine the value of the Kruskal-Wallis test statistics:
c.
To compare: the test result in part (a) with the analysis of variance test.
c.
Answer to Problem 15.69SE
Yes.
Explanation of Solution
Given:
Five samples of liquid waste were taken at the output of each four industrial plants.
The data is shown in the given below table
Calculation:
The null hypothesis states that there is all population means are equal
The alternative hypothesis states the opposite of the null hypothesis:
Let us determine the necessary sums:
Determine the value of total-group variability. Total
Total
Determine the value of the sum of the square of the square between groups:
The value of the sum of squares within groups is then the value of the total group variability decreased by the value of the sum of the square between groups.
Total
Total
The value of the test statistic F is then
Combine the information in an ANOVA table:
| Source | df | SS | MS | F |
| Treatments | 3 | 0.464895 | 0.154965 | 5.2 |
| Error | 16 | 0.4768 | 0.0298 | |
| Total | 19 | 0.941695 |
The
If the
There is sufficient evidence to support the claim that there is a difference in the mean amounts of effluents discharged by the four plants.
Want to see more full solutions like this?
Chapter 15 Solutions
EP INTRODUCTION TO PROBABILITY+STAT.


 Glencoe Algebra 1, Student Edition, 9780079039897...AlgebraISBN:9780079039897Author:CarterPublisher:McGraw Hill
 Big Ideas Math A Bridge To Success Algebra 1: Stu...AlgebraISBN:9781680331141Author:HOUGHTON MIFFLIN HARCOURTPublisher:Houghton Mifflin Harcourt
 Holt Mcdougal Larson Pre-algebra: Student Edition...AlgebraISBN:9780547587776Author:HOLT MCDOUGALPublisher:HOLT MCDOUGAL