
Concept explainers
Videos
To write:
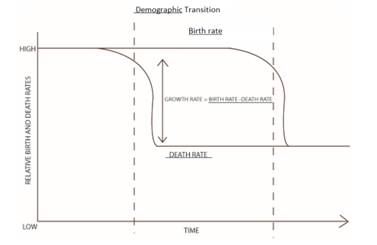
The labels of the figure that follows, which illustrates the predicted pattern of changes in human
Introduction:
The birth rate is the number of live births in a particular time and the death rate is the number of the people deceased in a particular time. In humans, it is observed a decrease in the rate of death has been followed by a drop in the rate of birth. The speed of this adjustment contributes to determining future population growth.
Explanation of Solution
The changes in the population are termed as the demographic transition. The growth rate of the population is determined by subtracting the death rate from the birth rate.
In the given graph, in the beginning, the death and birth rates are high and the population growth is constant. Then in the demographic transition, the birth rates remain the same but the death rate falls. Then in the graph, the birth rate drops and the death rate remains constant.
A labeled
Want to see more full solutions like this?
Chapter 15 Solutions
Biology: Science for Life with Physiology (6th Edition) (Belk, Border & Maier, The Biology: Science for Life Series, 5th Edition)


- The per capita birth (b) and death (d) rates are measured for two populations across a range of population sizes in the attached figure. The equation for exponential growth rate is dN/dt=rN where the per capita growth rate is r=(b-d). The equation for logistic population growth rate is dN/dt=rN(1-N/K). With logistic growth, r varies as a function of the population size with density-dependent birth and/or death rates. See attached image If the death rate decreased, what would happen to the population trajectory for population A? a) increase faster b) increase slower c) decrease faster d) decrease slowerarrow_forwardPlease help me to get aswers thank you Define and give an example of each of the following. You may use examples from the Human Population Growth A) Density-dependent control on human population growth B) Density-independent control on human population growtharrow_forwardVisit the website of the Population Reference Bureau, www.prb.org (Links to an external site.). Find the most recent “World Population Data Sheet” under the Data section. Choose two nations to compare with respect to: birth rate, death rate, infant mortality rate, rate of population growth, and/or other data indicators of interest to you. What do these data tell you about the health of the populations of these countries? Add references you used and an accurate data sheetarrow_forward
- The moose population in Northern Alberta is estimated to be around 11, 800. During the year, there were 4557 births, 3587 deaths, 84 immigrations and 48 emigrations. Calculate the per capita growth rate. Express your answer as a value between 0 and 1 rounded to two decimal places. If the population is decreasing indicate this with a negative sign. Answerarrow_forwardA population of Giant armadillo, an endangered species found in South America, increased in numbers from 152 to 174 from 2001 to 2006. The per capita growth rate for the armadillo population is ? (three decimal places)arrow_forwardDuring 24 months, a population of 5,000 prairie dogs experienced 6 500 births and 5 560 deaths. Forty two prairie dogs left the population, and 85 prairie dogs joined the population. Calculate the growth of the prairie dog population during the 24 months. Calculate the per capita growth rate of the prairie dog population and the per capita growth rate per year. Show all work and explanation.arrow_forward
- Draw a graph with a growth curve for a population that starts at 10 individuals and experiences exponential growth. Draw a second graph with a growth curve for a population that starts with 10 individuals and undergoes logistic growth. The second graph should have a carrying capacity of 100 individuals. Please give a proper written explanation for the graphs.arrow_forwardWhich of the following is a density-independent factor limiting population growth in humans? fatal genetic diseases temperature competition for food fatal contagious diseasesarrow_forwardThe moose population in Northern Alberta is estimated to be around 11, 800. During the year, there were 5054 births, 4567 deaths, 25 immigrations and 52 emigrations. Calculate the per capita growth rate. Express your answer as a value between 0 and 1 rounded to two decimal places. If the population is decreasing indicate this with a negative sign.arrow_forward
- When there are no limits to population growth, rmax represents which of the following? maximum reproductive rate maximum per capita reproduction rate maximum per capita growth rate none of the options are correct maximum life history rate Which of the following traits would not be considered a life history trait? age at maturity how often they reproduce size of their horns size of offspring none of the options are correctarrow_forwardThe common carp is an non-native fish species in North America. A few individuals are introduced into a lake near Ottawa, where they experience no predation or competition from native fishes. What kind of growth the population of carp is expected to follow in the first few years following its introduction. Logistic Exponential Logarithmic Lineararrow_forwardWhat are the two key concepts for this section? Listthree variables that affect the growth and decline ofhuman populations. How can we calculate the population change of an area? Define the total fertilityrate (TFR). How has the global TFR changed since1955? Summarize the story of population growth inthe United States. List six changes in lifestyles thathave taken place in the United States during the 20thcentury, leading to a rise in per capita resource use.arrow_forward
 Case Studies In Health Information ManagementBiologyISBN:9781337676908Author:SCHNERINGPublisher:Cengage
 Biology (MindTap Course List)BiologyISBN:9781337392938Author:Eldra Solomon, Charles Martin, Diana W. Martin, Linda R. BergPublisher:Cengage Learning
 Biology Today and Tomorrow without Physiology (Mi...BiologyISBN:9781305117396Author:Cecie Starr, Christine Evers, Lisa StarrPublisher:Cengage Learning