
Concept explainers
Videos
To write:
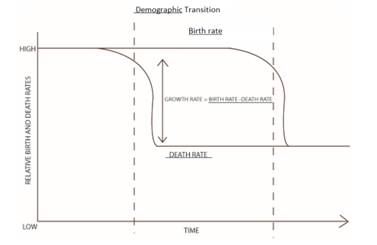
The labels of the figure that follows, which illustrates the predicted pattern of changes in human
Introduction:
The birth rate is the number of live births in a particular time and the death rate is the number of the people deceased in a particular time. In humans, it is observed a decrease in the rate of death has been followed by a drop in the rate of birth. The speed of this adjustment contributes to determining future population growth.
Explanation of Solution
The changes in the population are termed as the demographic transition. The growth rate of the population is determined by subtracting the death rate from the birth rate.
In the given graph, in the beginning, the death and birth rates are high and the population growth is constant. Then in the demographic transition, the birth rates remain the same but the death rate falls. Then in the graph, the birth rate drops and the death rate remains constant.
A labeled
Want to see more full solutions like this?
Chapter 15 Solutions
Pearson eText Biology: Science for Life with Physiology -- Instant Access (Pearson+)


- Visit the Gapminder.org website (the same one you used for your Health Systems assignment). Compare the growth rate/ population size to factors that have to do with climate change, such as CO2 emissions, for two different countries. In your post, discuss which factors you chose to review and the results for the two countries (name them!) for comparison. What are the public health implications of this data? Use Gapminder.org website to answer the question and other sources and link them for me thank you.arrow_forwardVisit the Gapminder.org website (the same one you used for your Health Systems assignment). Compare the growth rate/ population size to factors that have to do with climate change, such as CO2 emissions, for two different countries. In your post, discuss which factors you chose to review and the results for the two countries (name them!) for comparison. What are the public health implications of this data? Add the link sources please and thank.arrow_forwardVisit the website of the Population Reference Bureau, www.prb.org (Links to an external site.). Find the most recent “World Population Data Sheet” under the Data section. Choose two nations to compare with respect to: birth rate, death rate, infant mortality rate, rate of population growth, and/or other data indicators of interest to you. What do these data tell you about the health of the populations of these countries? Add the sources you usedarrow_forward
- The following equation is used to calculate the population growth rate, Ro, per generation from a life table. Iy is survival probability from birth to age x and my is fecundity at age x. Ro = Elkm Multiplying ly and my and summing it over all age categories in the life table gives the population growth rate per generation because: Calculating the reproductive output for each age class requires considering the survival probability to that age (a dead individual does not reproduce) and the fecundity at that age by multiplying them with each other. Summing over reproductive output for all age classes gives the total per capita growth rate of the population The fecundity at each age is lower when the survival is higher because of energy constraints. Multiplying probability of survival and fecundity in each age class takes this trade-off into account. Summing over reproductive output for all age classes gives the total per capita growth rate of the population The resulting type of growth…arrow_forwardAnalyze the graphs below. Which growth model (exponential or logis- tic) would apply to a population of squirrels arriving on a new island? Assume the squirrels have no way to leave. Answer the following questions: 1. Which growth model (exponential or logistic) fits the squirrel scenario? 2. Why did you choose this growth model? (think about the difference between the 2 types) Exponential Growth Logistic Growth Carrying capacity Time Timearrow_forwardThe moose population in Northern Alberta is estimated to be around 11, 800. During the year, there were 5054 births, 4567 deaths, 25 immigrations and 52 emigrations. Calculate the per capita growth rate. Express your answer as a value between 0 and 1 rounded to two decimal places. If the population is decreasing indicate this with a negative sign.arrow_forward
- A population of rabbits, when introduced to a new environment with abundant resources, would most likely display what type of growth? Logistic growth Exponential growth Negative growth No growtharrow_forwardVisit the Gapminder.org website (the same one you used for your Health Systems assignment). Compare the growth rate/ population size to factors that have to do with climate change, such as CO2 emissions, for two different countries. In your post, discuss which factors you chose to review and the results for the two countries (name them!) for comparison. What are the public health implications of this data? Add sources.arrow_forwardBased on this figure of a sensitivity analysis: growth rate (X) 2 1 0 Response to 10% increase in vital rates adult current juvenile adult population survival survival reproduction Would a 10% increase in adult reproduction save the population from a decline? Yes No There is not enough information to sayarrow_forward
- Visit the website of the Population Reference Bureau, www.prb.org (Links to an external site.). Find the most recent “World Population Data Sheet” under the Data section. Choose two nations to compare with respect to: birth rate, death rate, infant mortality rate, rate of population growth, and/or other data indicators of interest to you. What do these data tell you about the health of the populations of these countries? Add references you used and an accurate data sheetarrow_forwardAssume a population of desert tortoises has a per capita growth rate (r) or 0.039. If this rate could be sustained, how long would it take for the population that is currently 186 individuals to reach 450 individuals? (just give the simplest expression with the data provided). Edit View Insert Format Tools Table 12pt Paragraph BIU AT²arrow_forward__________ exists when deaths are balanced by births so that the population does not increasearrow_forward
 Case Studies In Health Information ManagementBiologyISBN:9781337676908Author:SCHNERINGPublisher:Cengage