Excursions in Modern Mathematics, Books a la carte edition (9th Edition)
9th Edition
ISBN: 9780134469041
Author: Peter Tannenbaum
Publisher: PEARSON
expand_more
expand_more
format_list_bulleted
Videos
Textbook Question
Chapter 15, Problem 58E
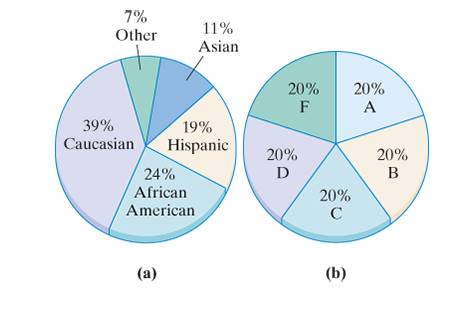
Exercises 57 and 58 refer to the mode of a data set. The mode of a data set is the data point that occurs with the highest frequency. When there are several data points (or categories) tied for the most frequent, each of them is a mode, but if all data points have the same frequency, rather than say that every data point is a mode, it is customary to say that there is no mode.
a. Find the mode category for the data set described by the pie chart in Fig. 15-19(a).
b. Find the mode category for the data set shown in Fig. 15-19(b). If there is no mode, your answer should indicate so.
Expert Solution & Answer
Want to see the full answer?
Check out a sample textbook solution
Chapter 15 Solutions
Excursions in Modern Mathematics, Books a la carte edition (9th Edition)
Ch. 15 - Exercises 1 through 4 refer to the data set shown...Ch. 15 - Exercises 1 through 4 refer to the data set shown...Ch. 15 - Exercises 1 through 4 refer to the data set shown...Ch. 15 - Exercises 1 through 4 refer to the data set shown...Ch. 15 - Exercises 5 through 10 refer to Table 15-13, which...Ch. 15 - Exercises 5 through 10 refer to Table 15-13, which...Ch. 15 - Exercises 5 through 10 refer to Table 15-13, which...Ch. 15 - Exercise 5 through 10 refer to Table 15-13, which...Ch. 15 - Exercise 5 through 10 refer to Table 15-13, which...Ch. 15 - Exercise 5 through 10 refer to Table 15-13, which...
Ch. 15 - Exercise 11 and 12 refer to the bar graph shown in...Ch. 15 - Exercise 11 and 12 refer to the bar graph shown in...Ch. 15 - Exercise 13 and 14 refer to the pie chart in Fig....Ch. 15 - Exercise 13 and 14 refer to the pie chart in Fig....Ch. 15 - Table 15-14 shows the class interval frequencies...Ch. 15 - Table 15-15 shows the class interval frequencies...Ch. 15 - Table 15-16 shows the percentage of U.S. working...Ch. 15 - Table 15-17 shows the percentage of U.S. workers...Ch. 15 - Exercises 19 and 20 refer to Table 15-18, which...Ch. 15 - More than Less than or equal to Number of babies...Ch. 15 - Exercises 21 and 22 refer to the two histograms...Ch. 15 - Exercises 21 and 22 refer to the two histograms...Ch. 15 - Consider the data set {3,5,7,4,8,2,8,3,6}. a.Find...Ch. 15 - Consider the data set {4,6,8,5.2,10.4,10,12.6,13}...Ch. 15 - Find the average A and median M of each of the...Ch. 15 - Find the average A and median M of each of the...Ch. 15 - Find the average A and median M of each of the...Ch. 15 - Find the average A and median M of each of the...Ch. 15 - Table 15-19 shows the results of a 5-point musical...Ch. 15 - Table 15-20 shows the ages of the firefighters in...Ch. 15 - Table 15-21 shows the relative frequencies of the...Ch. 15 - Table 15-22 shows the relative frequencies of the...Ch. 15 - Consider the data set {5,7,4,8,2,8,3,6}. a. Find...Ch. 15 - Consider the data set {4,6,8,5.2,10.4,10,12.6,13}....Ch. 15 - For each data set, find the 75th and the 90th...Ch. 15 - For each data set, find the 10th and the 25th...Ch. 15 - Table 15-20 Age 25 27 28 29 30 Frequency 2 7 6 9...Ch. 15 - This exercise refers to the math quiz scores shown...Ch. 15 - Prob. 39ECh. 15 - Exercise 39 and 40 refer to SAT test scores for...Ch. 15 - Consider the data set {5,7,4,8,2,8,3,6}. a. Find...Ch. 15 - Consider the data set {4,6,8,5.2,10.4,10,12.6,13}....Ch. 15 - Prob. 43ECh. 15 - This exercise refers to the distribution of the...Ch. 15 - Exercises 45 and 46 refer to the two box plots in...Ch. 15 - Exercises 45 and 46 refer to the two box plots in...Ch. 15 - For the data set {5,7,4,8,2,8,3,6}, find a. the...Ch. 15 - For the data set {4,6,8,5.2,10.4,10,12.6,13}, find...Ch. 15 - A realty company has sold N=341 homes in the last...Ch. 15 - Exercise 45 and 46 refer to the box plot in...Ch. 15 - Prob. 51ECh. 15 - For Exercises 51 through 54, you should use the...Ch. 15 - For Exercises 51 through 54, you should use the...Ch. 15 - For Exercises 51 through 54, you should use the...Ch. 15 - The purpose of Exercises 55 and 56 is to practice...Ch. 15 - The purpose of Exercises 55 and 56 is to practice...Ch. 15 - Exercises 57 and 58 refer to the mode of a data...Ch. 15 - Exercises 57 and 58 refer to the mode of a data...Ch. 15 - Mikes average on the first five exams in Econ 1A...Ch. 15 - Explain each of the following statements regarding...Ch. 15 - In 2006, the median SAT score was the average of...Ch. 15 - In 2004, the third quartile SAT scores was...Ch. 15 - Prob. 63ECh. 15 - Suppose that the average of 10 numbers is 7.5 and...Ch. 15 - Prob. 65ECh. 15 - What happens to the five-number summary of the...Ch. 15 - Prob. 67ECh. 15 - Prob. 68ECh. 15 - Prob. 69ECh. 15 - Prob. 70ECh. 15 - Prob. 71ECh. 15 - Prob. 72ECh. 15 - Prob. 73ECh. 15 - Suppose that the standard deviation of the data...Ch. 15 - Chebyshevs theorem. The Russian mathematician P.L....
Knowledge Booster


Learn more about
Need a deep-dive on the concept behind this application? Look no further. Learn more about this topic, subject and related others by exploring similar questions and additional content below.Recommended textbooks for you
 Holt Mcdougal Larson Pre-algebra: Student Edition...AlgebraISBN:9780547587776Author:HOLT MCDOUGALPublisher:HOLT MCDOUGAL
 Big Ideas Math A Bridge To Success Algebra 1: Stu...AlgebraISBN:9781680331141Author:HOUGHTON MIFFLIN HARCOURTPublisher:Houghton Mifflin Harcourt
Holt Mcdougal Larson Pre-algebra: Student Edition...
Algebra
ISBN:9780547587776
Author:HOLT MCDOUGAL
Publisher:HOLT MCDOUGAL
Big Ideas Math A Bridge To Success Algebra 1: Stu...
Algebra
ISBN:9781680331141
Author:HOUGHTON MIFFLIN HARCOURT
Publisher:Houghton Mifflin Harcourt
How to make Frequency Distribution Table / Tally Marks and Frequency Distribution Table; Author: Reenu Math;https://www.youtube.com/watch?v=i_A6RiE8tLE;License: Standard YouTube License, CC-BY
Frequency distribution table in statistics; Author: Math and Science;https://www.youtube.com/watch?v=T7KYO76DoOE;License: Standard YouTube License, CC-BY
Frequency Distribution Table for Grouped/Continuous data | Math Dot Com; Author: Maths dotcom;https://www.youtube.com/watch?v=ErnccbXQOPY;License: Standard Youtube License