
a)
To plot:Graphical representation of inflation rates.
a)
Answer to Problem 8NP

Explanation of Solution
Given Information:
Given the following information:
L = 0.2Y-500i
L = M/P
Y = 1000
r = 0.04
i = r + inflation(p)
Where,
i is the nominal interest rate
r is the real interest rate
M is the nominal money supply
L is the real money demand
Substitute the value of nominal interest rate into the equation of real money demand to get:
Since at equilibrium L = M/P, therefore,
Formula to calculate seignorage revenue is:
Substituting equation (1) in the above equation to get
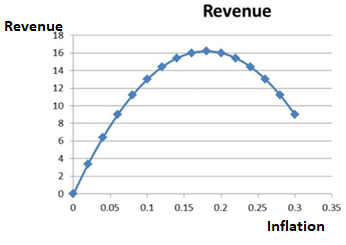
Plotting the above equation for values of p = 0, 0.02, 0.04...0.3 in the form of a graph gives the following:
Table-1
| Inflation | Revenue |
| 0 | 0 |
| 0.02 | 3.4 |
| 0.04 | 6.4 |
| 0.06 | 9 |
| 0.08 | 11.2 |
| 0.1 | 13 |
| 0.12 | 14.4 |
| 0.14 | 15.4 |
| 0.16 | 16 |
| 0.18 | 16.2 |
| 0.2 | 16 |
| 0.22 | 15.4 |
| 0.24 | 14.4 |
| 0.26 | 13 |
| 0.28 | 11.2 |
| 0.3 | 9 |
Introduction:
Inflation is the persistent increase in price level over a short period of time.
b)
Inflation rate that maximizes seignorage.
b)
Answer to Problem 8NP
Inflation rate that maximizes seignorage is 0.18.
Explanation of Solution
Given Information:
L = 0.2Y-500i
L = M/P
Y = 1000
r = 0.04
i = r + inflation(p)
Where,
i is the nominal interest rate
r is the real interest rate
M is the nominal money supply
L is the real money demand
| Inflation | Revenue |
| 0 | 0 |
| 0.02 | 3.4 |
| 0.04 | 6.4 |
| 0.06 | 9 |
| 0.08 | 11.2 |
| 0.1 | 13 |
| 0.12 | 14.4 |
| 0.14 | 15.4 |
| 0.16 | 16 |
| 0.18 | 16.2 |
| 0.2 | 16 |
| 0.22 | 15.4 |
| 0.24 | 14.4 |
| 0.26 | 13 |
| 0.28 | 11.2 |
| 0.3 | 9 |
As it can be seen from the above table, value of seignorage revenue gets maximized at the inf1ation rate of 0.18.
Introduction:
Inflation is the persistent increase in price level over a short period of time.
c)
Maximum amount of seignorage revenue.
c)
Answer to Problem 8NP
The maximum amount of seignorage that is earned is 16.2 units.
Explanation of Solution
Given Information:
L = 0.2Y-500i
L = M/P
Y = 1000
r = 0.04
i = r + inflation(p)
Where,
i is the nominal interest rate
r is the real interest rate
M is the nominal money supply
L is the real money demand
| Inflation | Revenue |
| 0 | 0 |
| 0.02 | 3.4 |
| 0.04 | 6.4 |
| 0.06 | 9 |
| 0.08 | 11.2 |
| 0.1 | 13 |
| 0.12 | 14.4 |
| 0.14 | 15.4 |
| 0.16 | 16 |
| 0.18 | 16.2 |
| 0.2 | 16 |
| 0.22 | 15.4 |
| 0.24 | 14.4 |
| 0.26 | 13 |
| 0.28 | 11.2 |
| 0.3 | 9 |
The maximum amount of seignorage that is earned is 16.2 units by referring to above table.
Introduction:
Total revenue is calculated by multiplying price into Quantity. It is the sale amount which is earned.
d)
Graphical representation of inflation rates, maximum value of inflation and revenue when Y = 1000 and r 0.08.
d)
Answer to Problem 8NP
Revenue of seignorage is maximized (at the value of 12.8) at inflation rate of 0.16.
Explanation of Solution
Given Information:
L = 0.2Y-500i
L = M/P
Y = 1000
r = 0.08
i = r + inflation(p)
Where,
i is the nominal interest rate
r is the real interest rate
M is the nominal money supply
L is the real money demand
At equilibrium L = M/P, therefore,
For Y = 1000 and r = 0.08 gives the result as:
Table-2
| Inflation | New Revenue |
| 0 | 0 |
| 0.02 | 3 |
| 0.04 | 5.6 |
| 0.06 | 7.8 |
| 0.08 | 9.6 |
| 0.1 | 11 |
| 0.12 | 12 |
| 0.14 | 12.6 |
| 0.16 | 12.8 |
| 0.18 | 12.6 |
| 0.2 | 12 |
| 0.22 | 11 |
| 0.24 | 9.6 |
| 0.26 | 7.8 |
| 0.28 | 5.6 |
| 0.3 | 3 |
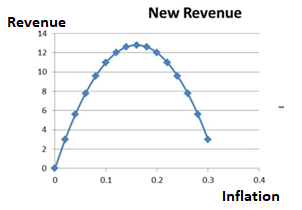
Revenue of seignorage is maximized (at the value of 12.8) at inflation rate of 0.16.
Introduction:
Inflation is the persistent increase in price level over a short period of time.
Want to see more full solutions like this?

- The demand for real money balances is given by , where M is the quantity of money, P is the price level, Y is output, and i is the nominal interest rate which is measured in percent. At the beginning of the year, the nominal interest rate is 5%. Over the year, the monetary base increases by 4%, the money multiplier increases by 2%, the output increases by 1% percent, and the nominal interest rate decreases by 10 BASIS POINTS. (a) If the ex ante real interest rate equals 0.5%, find the expected inflation rate at the beginning of the year. (b) Calculate the percentage change in the velocity of money. (c) [In answering this question, you are allowed to use the approximations regarding percentage changes; see page 4 of the math review (slide set 3).] Calculate the actual inflation rate. (d) Is it true that purchasing power was transferred from lenders to borrowers?arrow_forwardAssume that a government cuts its expenditure and therefore runs a public-sector surplus. (a) What will this mean for the equilibrium national income?(b) What will this mean for the demand for money and to interest rates?(c) Under what circumstances will it lead to a (i) decrease in money supply, and (ii) no change in money supply?(d) What effect will each of the two scenarios in (c) will have on the rate of interest rate compared with its original level?arrow_forwardConsider the following economy: Labor supply: Nt= 90 Capital stock: Kt = 90 Government spending: Gt = 20 Tax collections: Tt = 20 Production function: Yt = 2(Kt)0.5 (Nt)0.5 Real money demand Lt = 2Yt - 200rt Consumption function: Ct = 16 + 0.8(Yd)t Domestic price level: Pt = 4 Investment function: It = 25 - 50rt Nominal money supply: Mt = 1296 Suppose that the government decreases taxes to T=10. Find the new short-run equilibrium levels of output and interest ratearrow_forward
- Assume that the demand for real money balance (M / P) is M / P = 0.8Y – 200i, where Y is national income, and i is the nominal interest rate (in percent). The real interest rate r is fixed at 5 percent by the investment and saving functions. The expected inflation rate equals the rate of nominal money growth. If Y is 2,500, P is 1.2, and the growth rate of nominal money is 2 percent, what must i and M be? Show all your work, show formula used and explain why.arrow_forwardSuppose that expanded credit card availability makes people demand less money at every value of money. a) Using the graph of the money market, show and explain how this change will impact the equilibrium value of money and the equilibrium price level in the economy (do not forget to label the axes). Using the graph of the money market, show and explain the action the Federal Reserve could take to return the economy to its initial price level.arrow_forwardIn an economy, the money supply growth rate is 5.0%, the equilibrium real interest rate is 1.5%, the potential growth rate is 4.0%, the economic growth rate is 1.0%, the inflation rate is 3.0%, the unemployment rate is 4.5%, and the rate of increase in the circulation speed is -2%. In this case, in an economy that pursues an inflation target of 2.0%, what is the appropriate interest rate target based on Taylor's rule? (Omit the unit and answer with the first decimal place.)arrow_forward
- Suppose that the supply of credit cards is given by (1/200) X = q, the nominal interest rate is 0.06, real GDP is Y = 52, and the price level is P = 105. What must be the quantity of money supplied for this money market to be in equilibrium. Round your answer to the nearest whole number.arrow_forwardConsumption function C=250+0.6(Y-T) Investment I=100-20r Money demand function (M/P)=Y-20r a. Government purchases and taxes are both 100. In the accompanying diagram, graph the IS curve for r ranging from 0 to 8 by dragging and dropping the end points to the correct locations. b. The money supply M is 2,875 and the price level P is 5. In the accompanying diagram, graph the LM curve for r ranging from 0 to 8 by dragging and dropping the end points to the correct locations. c. Find the equilibrium interest rate, r, and the equilibrium level of income Y.arrow_forwardSuppose that the real money demand function is L(Y,r+πe)=0.3Y÷ (r+πe) Where Y is real output, r is the real interest rate, and πe is the expected rate of inflation. Real output is constant over time at Y = 1500. The real interest rate is fixed in the goods market at r = 0.5 per year. Suppose that the nominal money supply is growing at the rate of 10% per year and that this growth rate is expected to persist for ever. Currently, the nominal money supply is M = 400. What are the values of the real money supply and the current price level? (Hint: What is the value of the expected inflation rate that enters the money demand function?). Suppose that the nominal money supply is M = 400. The Bank of Namibia announces that from now on the nominal money supply will grow at the rate of 5% per year. If everyone believes this announcement, and if all markets are in equilibrium, what are the values of real money supply and the current price level? Explain the effects on the…arrow_forward
- The money demand function is (M/P)d = Y-150rThe money supply M is 1,000 and the price level P is 2. For this economy, use a graph to illustrate the LM curve for r ranging from 0 to 8.arrow_forwardThe following set of equations describe an economy: C = 14,400 + 0.5 (Y − T) − 40,000r Ip = 8,000 − 20,000r G = 7,800 NX = 1,800 T = 8,000 Y* = 40,000 Suppose that the real interest rate (r) is 10%. Is the economy in long run equilibrium? If not, what real interest rate should central bank set to restore the economy back to the long run equilibrium? And what methods can central bank use to adjust the interest rate? (Round your answer to 2 decimal places)arrow_forwardA Keynesian economy is described by the following equations. Consumption Cd = 250 + 0.5(Y - T) - 250r Investment Id = 250 - 250r Government purchases G = 300 Government taxes T = 300 Real money demand L = 0.5Y - 500r + πe Money supply M = 3000 Full-employment output Y = 1250 Expected inflation πe = 0 (HINT a: The expected rate of inflation is assumed to equal zero so that money demand depends directly on the real interest rate, which equals the nominal interest rate. Domestic Savings, Sd =Y - C - G. In equilibrium set domestic savings equal to domestic investment, so Sd = Id) Calculate the values of the real interest rate (r), consumption (Cd), and investment (Id) for the economy in general equilibrium.arrow_forward
 Brief Principles of Macroeconomics (MindTap Cours...EconomicsISBN:9781337091985Author:N. Gregory MankiwPublisher:Cengage Learning
 Essentials of Economics (MindTap Course List)EconomicsISBN:9781337091992Author:N. Gregory MankiwPublisher:Cengage Learning