
Concept explainers
Videos
a. The histogram at the top of Figure 15.22 shows thedistribution of annual household incomes in SwankCounty. Without calculating the median or averageannual household income in Swank County, make aneducated guess about which one is greater. Describeyour thinking.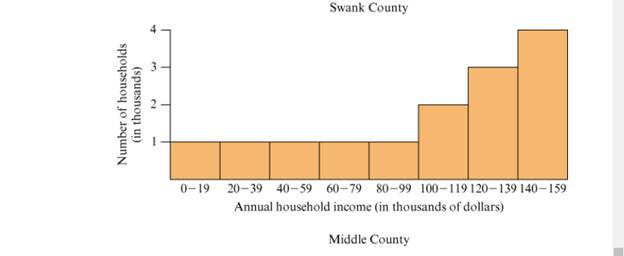
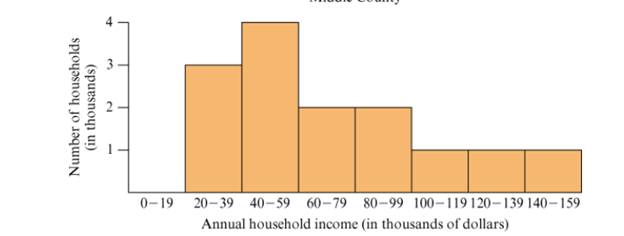
Figure 15.22 Annual household Incomes in Swankand Middle Counties.
b. Determine the approximate values of the median andaverage annual household incomes in Swank Countyfrom the histogram at the top of Figure 15.22. Whichis greater, the average or the median? Compare with part(a).
c. The histogram at the bottom of Figure 15.22 shows the distribution of annual household incomes in Middle County. Without calculating the median or average annual household income in Middle County, make an educated guess about which one is greater. Describe your thinking.
d. Determine the approximate values of the median and average annual household income in Middle County from the histogram at the bottom of Figure 15.22. Which is greater, the average or the median?
Want to see the full answer?
Check out a sample textbook solution
Chapter 15 Solutions
MATHEMATICS FOR ELEM. TEACHING CUSTOM
Additional Math Textbook Solutions
Mathematics for the Trades: A Guided Approach (10th Edition) - Standalone book
Discrete Mathematics and Its Applications ( 8th International Edition ) ISBN:9781260091991
Discrete Mathematics with Graph Theory (Classic Version) (3rd Edition) (Pearson Modern Classics for Advanced Mathematics Series)
A Problem Solving Approach To Mathematics For Elementary School Teachers (13th Edition)
Probability and Statistics for Engineers and Scientists
Basic College Mathematics (12th Edition)


 Holt Mcdougal Larson Pre-algebra: Student Edition...AlgebraISBN:9780547587776Author:HOLT MCDOUGALPublisher:HOLT MCDOUGAL
 Functions and Change: A Modeling Approach to Coll...AlgebraISBN:9781337111348Author:Bruce Crauder, Benny Evans, Alan NoellPublisher:Cengage Learning