
Mathematical Statistics with Applications
7th Edition
ISBN: 9780495110811
Author: Dennis Wackerly, William Mendenhall, Richard L. Scheaffer
Publisher: Cengage Learning
expand_more
expand_more
format_list_bulleted
Videos
Textbook Question
Chapter 15.4, Problem 12E
The accompanying table gives the scores of a group of 15 students in mathematics and art.
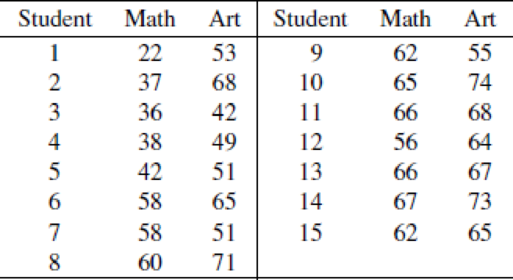
- a Use Wilcoxon’s signed-rank test to determine if the locations of the distributions of scores for these students differ significantly for the two subjects. Give bounds for the p-value and indicate the appropriate conclusion with α = .05.
- b State specific null and alternative hypotheses for the test that you conducted in part (a).
Expert Solution & Answer
Want to see the full answer?
Check out a sample textbook solution
Students have asked these similar questions
A tax accountant would like to test the claim that the proportion of individuals who owe when filing their taxes is less than 0.20. If the z− test statistic was calculated as z=−2.11, does the tax accountant have enough evidence to reject the null hypothesis? Assume α=0.005.
Move the blue dot to choose the appropriate test (left-, right, or two-tailed). Then, use the graph below to show the test statistic, p-value, and the rejection region to make a conclusion about the hypothesis test.
powered by
Move the blue dot to choose the appropriate test
α=0.01
α=0.025
α=0.05
α=0.1
Significance level = 0.01
Select the correct answer below:
There is enough evidence to suggest the proportion of individuals who owe when filing their taxes is less than 0.20.
There is not enough evidence to suggest the proportion of individuals who owe when filing their taxes is less than 0.20.
There is enough evidence to suggest the proportion of individuals who owe when filing their taxes is greater than 0.20.…
.A sample of 9 measurements, randomly selected from a normally distributed population,
resulted in x= 2.6, and s= 0.9 Conduct a hypothesis test to verify the claim that the
population mean is greater than 2.5 . Use a=.05
The desired percentage of SiO2 in a certain type of aluminous cement is 5.5. To test whether the true average percentage is 5.5 for a particular production facility, 16 independently obtained samples are analyzed. Suppose that the percentage of SiO2 in a sample is normally distributed with ? = 0.32 and that x = 5.21. (Use ? = 0.05.)
(a) Does this indicate conclusively that the true average percentage differs from 5.5?State the appropriate null and alternative hypotheses.
H0: ? = 5.5Ha: ? ≠ 5.5H0: ? = 5.5Ha: ? ≥ 5.5 H0: ? = 5.5Ha: ? < 5.5H0: ? = 5.5Ha: ? > 5.5
Calculate the test statistic and determine the P-value. (Round your test statistic to two decimal places and your P-value to four decimal places.)
z
=
P-value
=
State the conclusion in the problem context.
Do not reject the null hypothesis. There is sufficient evidence to conclude that the true average percentage differs from the desired percentage.Reject the null hypothesis. There is sufficient evidence…
Chapter 15 Solutions
Mathematical Statistics with Applications
Ch. 15.3 - What significance levels between = .01 and = .15...Ch. 15.3 - Prob. 2ECh. 15.3 - Clinical data concerning the effectiveness of two...Ch. 15.3 - Prob. 4ECh. 15.3 - New food products are frequently subjected to...Ch. 15.3 - On clear, cold nights in the central Florida...Ch. 15.3 - A psychological experiment was conducted to...Ch. 15.3 - Refer to Exercise 12.15. Using the sign test, do...Ch. 15.3 - Prob. 9ECh. 15.4 - The accompanying table gives the scores of a group...
Ch. 15.4 - Refer to Exercise 15.4. What answers are obtained...Ch. 15.4 - Refer to Exercise 15.6(a). Answer the question by...Ch. 15.4 - Eight subjects were asked to perform a simple...Ch. 15.4 - Two methods, A and B, for controlling traffic were...Ch. 15.4 - Dental researchers have developed a new material...Ch. 15.4 - Refer to Exercise 12.16. With = .01, use the...Ch. 15.4 - Suppose that Y1, Y2,, Yn is a random sample from a...Ch. 15.4 - The spokesperson for an organization supporting...Ch. 15.6 - Find the p-values associated with each of the...Ch. 15.6 - In some tests of healthy, elderly men, a new drug...Ch. 15.6 - Two plastics, each produced by a different...Ch. 15.6 - Prob. 24ECh. 15.6 - Prob. 25ECh. 15.6 - Prob. 26ECh. 15.6 - Prob. 27ECh. 15.6 - Prob. 28ECh. 15.7 - The table that follows contains data on the leaf...Ch. 15.7 - Prob. 30ECh. 15.7 - Three different brands of magnetron tubes (the key...Ch. 15.7 - An experiment was conducted to compare the length...Ch. 15.7 - Prob. 33ECh. 15.7 - Prob. 34ECh. 15.7 - Prob. 35ECh. 15.8 - In a study of palatability of antibiotics for...Ch. 15.8 - Prob. 38ECh. 15.8 - Prob. 39ECh. 15.8 - A serious drought-related problem for farmers is...Ch. 15.8 - Prob. 41ECh. 15.8 - Prob. 42ECh. 15.8 - Prob. 43ECh. 15.8 - Prob. 44ECh. 15.8 - Prob. 45ECh. 15.9 - Prob. 46ECh. 15.9 - Prob. 47ECh. 15.9 - Prob. 48ECh. 15.9 - Prob. 49ECh. 15.9 - Prob. 50ECh. 15.9 - Prob. 52ECh. 15.10 - Prob. 53ECh. 15.10 - Prob. 54ECh. 15.10 - Prob. 55ECh. 15.10 - Prob. 56ECh. 15.10 - Prob. 57ECh. 15.10 - Prob. 58ECh. 15.10 - Refer to Exercise 11.4. Regard both book and...Ch. 15.10 - Prob. 60ECh. 15 - Prob. 62SECh. 15 - Prob. 63SECh. 15 - Prob. 64SECh. 15 - Prob. 65SECh. 15 - Prob. 67SECh. 15 - Prob. 69SECh. 15 - Prob. 70SECh. 15 - Prob. 71SECh. 15 - Prob. 72SECh. 15 - Prob. 74SECh. 15 - Prob. 75SECh. 15 - Prob. 76SECh. 15 - Prob. 77SECh. 15 - Prob. 78SE
Knowledge Booster


Learn more about
Need a deep-dive on the concept behind this application? Look no further. Learn more about this topic, statistics and related others by exploring similar questions and additional content below.Similar questions
- A manufacturer has developed a new fishing line, which he claims has a mean breaking strength of 15 kilograms with a standard deviation of 0.5 kilogram. To test the hypothesis that μ=15μ=15 kilograms against the alternative that p<15p<15 kilograms, a random sample of 50 lines will be tested. The critical region is defined to be x<14.9x<14.9(a) Find the probability of committing a type 1 error when H0H0 is true(b) Evaluate ββ for the alternatives p−14.8p−14.8 and μ=μ= 14.9 kilograms.arrow_forwardSuppose that the 101 randomly selected eighth-grade students (mentioned in question 6) took a “practice” test similar to the official standardized test a month before the official test was administered. The researchers reported that the (two-tailed) statistical test of the difference between the practice and official test scores resulted in t100 = -2.32, p < .05. (a) Given that the difference score was computed as D = (practice score – official score), do the reported results indicate that students scored significantly higher or lower on the official test relative to the practice test? Explain. (b) If we constructed the corresponding 95% confidence interval for the mean difference (between the practice and official test scores) in the population, would it include zero? Explain.arrow_forwardA researcher is using a two-tailed hypothesis test with α = 0.01 to evaluate the effect of a treatment. If theboundaries for the critical region are t = ± 2.845, then how many individuals are in the samplearrow_forward
- Suppose we want to compare the length of hospital stay for patients with the same diagnosis at two different hospitals. The results are shown in Table 9.10. 9.7 Why might a t test not be very useful in this case? 9.8 Carry out a nonparametric procedure for testing the hypothesis that lengths of stay are comparable in the two hospitals.arrow_forwardThe Office of the university registrar would like to know if such degree programs are related to the gender of the students. The test claim that the proportions of the students enrolled are equal in each degree program at alpha=0.10 Using the data on the number of currently enrolled students in each gender (M of F) in each of the four degree programs, find the: a. Table showing the observed and expected values b. Chi-square critical Value c. Chi-square test statistic d. Accept or Reject the null hypothesis?arrow_forwardA researcher is concerned that his new antihypertensive medication may be causing insomnia in some of his patients. Suppose he gathers an SRS of 65 patients treated with the study drug with a sample average of 6.6 hours of sleep and a σ=1.1. Assuming that insomnia can be quantified as an average of 4.5 hours of sleep, can we determine with 95% confidence that his drug avoids diagnosis of insomnia as a side-effect?arrow_forward
- A researcher is testing the effect of a new anxiety medication on reaction time. A sample of n=16 students is obtained and each student is given the normal does of the medicine and then 30 minutes later, their reaction time is measured. The reaction times for the sample was M=220 milliseconds with SS=6000. For students in the regular population μμ=200. a.) Are these data sufficient to conclude that the medication has a significant effect on reaction time? Use a two-tailed test with αα=.05. b.)Compute r2, the percentage of variance explained by the treatment effect.arrow_forwardSuppose X1, . . . , Xn be a random sample from the Beta(θ, 1) distribution. Find the P-value for the LRT test of the hypotheses H0 : θ ≥ 1 vs H1 : θ < 1arrow_forwardA random sample of 430 observations produced a sample proportion equal to 0.39. Find the critical and observed values of z for the following test of hypotheses using α=0.025. H0: p=0.30 versus H1: p≠0.30. Round your answers to two decimal places.arrow_forward
arrow_back_ios
arrow_forward_ios
Recommended textbooks for you
 Glencoe Algebra 1, Student Edition, 9780079039897...AlgebraISBN:9780079039897Author:CarterPublisher:McGraw Hill
Glencoe Algebra 1, Student Edition, 9780079039897...
Algebra
ISBN:9780079039897
Author:Carter
Publisher:McGraw Hill
Hypothesis Testing using Confidence Interval Approach; Author: BUM2413 Applied Statistics UMP;https://www.youtube.com/watch?v=Hq1l3e9pLyY;License: Standard YouTube License, CC-BY
Hypothesis Testing - Difference of Two Means - Student's -Distribution & Normal Distribution; Author: The Organic Chemistry Tutor;https://www.youtube.com/watch?v=UcZwyzwWU7o;License: Standard Youtube License