
Concept explainers
Videos
Peer mentor training at a firm. Refer to the Journal of Menegerial issues (Spring 2008) study of the impact of peer mentor training at a large software company, Exercise 9.55 (p. 540). Recall that participants volunteered to attend a 1-day peer mentor training sess1on. The trainee's level of competence 1n peer mentoring (measured on a 7-point scale) was measured at three different times in the study: 1 week before training, 2 days after training, and 2 months after training. Data (simulated) for 15 trainees are displayed in the accompanying table. A Minitab non parametric randomized block analysis is also provided below to compare the competence level distributions of the three time periods.
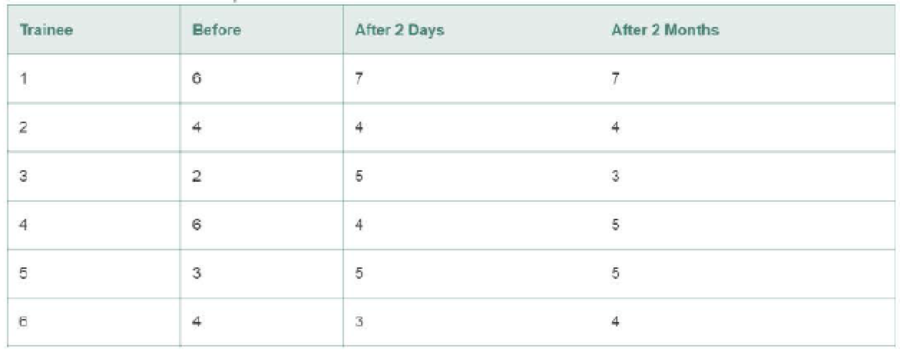

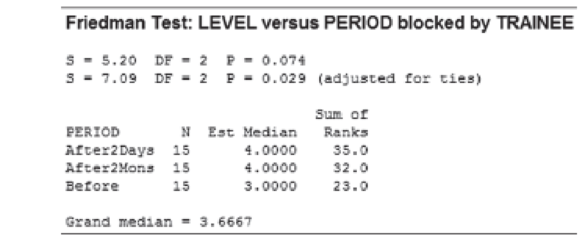
- a. Locate the rank sums on the printout.
- b. Use the rank sums to find the Friedman Fr statistic.
- c. Locate the test statistic and associated p-value on the printout.
- d. Conduct the test and give the appropriate conclusion in the words of the problem.
Want to see the full answer?
Check out a sample textbook solution
Chapter 15 Solutions
Student's Solutions Manual For Statistics For Business And Economics


- Stressed-Out Bus Drivers. Previous studies have shown that urban bus drivers have an extremely stressful job, and a large proportion of drivers retire prematurely with disabilities due to occupational stress. In the paper, “Hassles on the Job: A Study of a Job Intervention With Urban Bus Drivers” (Journal of Organizational Behavior, Vol. 20, pp. 199–208), G. Evans et al. examined the effects of an intervention program to improve the conditions of urban bus drivers.Amongother variables, the researchers monitored diastolic blood pressure of bus drivers in downtown Stockholm, Sweden. The data, in millimeters of mercury (mm Hg), on the WeissStats site are based on the blood pressures obtained prior to intervention for the 41 bus drivers in the study. Use the technology of your choice to do the following. a. Obtain a normal probability plot, boxplot, histogram, and stemand-leaf diagram of the data. b. Based on your results from part (a), can you reasonably apply the one-mean t-test to the…arrow_forwardThe National Transportation Safety Board wants to look at the safety of three different sizes of cars. Using the data below, determine the whether the mean pressure applied to the driver`s head during a crash is equal for each type of car at alpha = 0.01 Compact cars Midsize cars Full-size Cars 643 469 484 655 427 456 702 525 402 a) Ho: Ha : b) Decision c) Conclusionarrow_forwardTo combat antibiotic resistance, the Quality Improvement Consortium recommends a throat swab to confirm strep throat before a physician prescribes antibiotics to children under age 5. Nationally, 40 percent of children under 5 who received antibiotics did not have a throat swab. The Colorado Department of Health took a random sample of 100 children under the age of 5 who received antibiotics for throat infections and found that 30 did not have a throat swab. At α = .05, is this a statistically significant reduction over last year’s national rate of 40 percent? (a-1) Choose the correct null and alternative hypotheses. H0: π ≥ .40 vs. H1: π < .40 H0: π ≤ .40 vs. H1: π > .40 H0: π = .40 vs. H1: π ≠ .40 (a-2) Calculate the critical value. (A negative value should be indicated by a minus sign. Round your answer to 3 decimal places.) Critical value (a-3) Calculate the test statistic. (A negative value should be indicated by a minus sign. Round your…arrow_forward
- To combat antibiotic resistance, the Quality Improvement Consortium recommends a throat swab to confirm strep throat before a physician prescribes antibiotics to children under age 5. Nationally, 40 percent of children under 5 who received antibiotics did not have a throat swab. The Colorado Department of Health took a random sample of 60 children under the age of 5 who received antibiotics for throat infections and found that 18 did not have a throat swab. At α = .05, is this a statistically significant reduction over last year’s national rate of 40 percent? (a-1) Calculate the critical value. (A negative value should be indicated by a minus sign. Round your answer to 3 decimal places.) Critical value _____ (a-2) Calculate the test statistic. (A negative value should be indicated by a minus sign. Round your answer to 2 decimal places.) Test statistic _____arrow_forwardSince its removal from the banned substances list in 2004 by the World Anti-Doping Agency,caffeine has been used by athletes with the expectancy that it enhances their workout andperformance. However, few studies look at the role caffeine plays in sedentary females.Researchers at the University of Western Australia conducted a test in which they determined therate of energy expenditure (kilojoules) on 10 healthy, sedentary females who were nonregularcaffeine users. Each female was randomly assigned either a placebo or caffeine pill (6mg/kg) 60minutes prior to exercise. The subject rode an exercise bike for 15 minutes at 65% of theirmaximum heart rate, and the energy expenditure was measured. The process was repeated on aseparate day for the remaining treatment. The mean difference in energy expenditure (caffeine –placebo) was 18kJ with a standard deviation of 19kJ. If we assume that the differences follow anormal distribution can it be concluded that that caffeine appears to increase…arrow_forwardThe authors of the article “Predictive Model for PittingCorrosion in Buried Oil and Gas Pipelines”(Corrosion, 2009: 332–342) provided the data on whichtheir investigation was based.a. Consider the following sample of 61 observations onmaximum pitting depth (mm) of pipeline specimensburied in clay loam soil. 0.41 0.41 0.41 0.41 0.43 0.43 0.43 0.48 0.480.58 0.79 0.79 0.81 0.81 0.81 0.91 0.94 0.941.02 1.04 1.04 1.17 1.17 1.17 1.17 1.17 1.171.17 1.19 1.19 1.27 1.40 1.40 1.59 1.59 1.601.68 1.91 1.96 1.96 1.96 2.10 2.21 2.31 2.462.49 2.57 2.74 3.10 3.18 3.30 3.58 3.58 4.154.75 5.33 7.65 7.70 8.13 10.41 13.44Construct a stem-and-leaf display in which the twolargest values are shown in a last row labeled HI.b. Refer back to (a), and create a histogram based oneight classes with 0 as the lower limit of the firstclass and class widths of .5, .5, .5, .5, 1, 2, 5, and 5,respectively.c. The accompanying comparative boxplot fromMinitab shows plots of pitting depth for four differenttypes of soils.…arrow_forward
- Traumatic Brain Injury (TBI) is a significant health problem. TBI is caused by impacts to the head that might occurduring contact sports, motor vehicle accidents, and similar events. TBI is known to produce cognitive impairments and reductions in brain volume. In a recent, repeated-measures study on TBI, Zagorchev et al.(2016) observed that the size of the amygdala among mild TBI patients was reduced at 12 months after injury, relative to two months after injury. Suppose that a researcher is interested in replicating and extending this observation. She recruits n=8 participants with mild TBI and records the volume of a brain region at 2 months and again and again at 12 months. Her data are listed below a.) Test the hypothesis that volume of the brain region changed between 2 & 12 months. Use α=0.05, two-tailed b.) Compute the 80% confidence interval for the mean change in attention span for the populationarrow_forwardAngioplasty is a medical procedure in which an obstructed blood vessel is widened. In some cases, a wire mesh tube, called a stent, is placed in the vessel to help it remain open. The article “Long-term Outcomes of Patients Receiving Drug-eluting Stents” (A. Philpott, D. Southern, et al., Canadian Medical Association Journal, 2009:167–174) presents the results of a study comparing the effectiveness of a bare metal stent with one that that has been coated with a drug designed to prevent reblocking of the vessel. A total of 5320 patients received bare metal stents, and of these, 841 needed treatment for reblocking within a year. A total of 1120 received drug coated stents, and 134 of them required treatment within a year. a) Find a 98% confidence interval for the differences between the proportions for drug coated stents and bare metal stents. b) Suppose that additional patients are to be treated in order to increase the precision of the confidence interval. Three sampling plans are…arrow_forwardLactation promotes a temporary loss of bone mass to provide adequate amounts of calcium for milk production. The paper “Bone Mass Is Recovered from Lactation to Postweaning in Adolescent Mothers with Low Calcium Intakes” (Amer. J. of Clinical Nutr., 2004: 1322–1326) gave the following data on total body bone mineral content (TBBMC) (g) for a sample both during lactation (L) and in the postweaning period (P). SubjectL 1928 2549 2825 1924 1628 2175 2114 2621 1843 2541P 2126 2885 2895 1942 1750 2184 2164 2626 2006 2627 Does the data suggest that true average total body bone mineral content during postweaning exceeds that during lactation by more than 25 g? State and test the appropriate hypotheses using a significance level of .05.arrow_forward
- According to the U.S. Climate Data website, the average monthly rainfall totals (in inches) in San Diego, California for the months of July through December are shown in the Expected column of the table below. Assuming the significance level is p=0.95, what is the chi-square (χ2) critical value for one 6-month period? Does the data match the model? Month Observed(Inches) Expected(Inches) July 0.07 0.04 August 0.05 0.04 September 0.13 0.16 October 0.59 0.55 November 0.89 1.02 December 1.28 1.54 a The chi-square critical value is 1.15 and the data matches the model. b The chi-square critical value is 1.64 and the data matches the model. c The chi-square critical value is 1.15 and the data does not match the model. d The chi-square critical value is 1.64 and the data does not match the model.arrow_forwardWe are testing whether a particular program of low impact exercise can improve the cholesterol level of stroke patients. We enroll a group of stroke patients in our study, and after six weeks we measure their serum cholesterol level in mmol/L, resulting in the following data: 7.1 7.4 8.7 4.7 4.6 3.9 4.6 7.1 9.1 7.2 8.6 8.1 6.3 8 5.9 8.5 8.4 8 7.4 5.9 4.6 3.8 5.4 8.1 7.7 9.3 7.8 5.3 9 7.2 8.1 6.1 8.6 9.5 7.8 7.6 7.4 4.1 Construct a 92% confidence intervalarrow_forwardWe are testing whether a particular program of low impact exercise can improve the cholesterol level of stroke patients. We enroll a group of stroke patients in our study, and after six weeks we measure their serum cholesterol level in mmol/L, resulting in the following data: 6.1 9.3 6.3 4 9 5.5 6.3 4.2 4.7 7.8 4.3 7.5 9.1 4.2 6.9 8.1 5.6 9.4 8.3 8.8 7.2 5.7 6.5 3.8 3.8 9 9.4 4.5 8 7 4.5 9.4 6.6 4.1 6.6 9.1 3.9 5.3 (a) Construct a 95% confidence interval. _______< u < ______ From an existing study, we know that the average cholesterol level of all stroke patients is 7 mmol/L. We want to know if the level in our patients is significantly different from this. (b) What is our Test statistic? ______ (c) What is the two-tailed p-value of this result? ______arrow_forward
 Glencoe Algebra 1, Student Edition, 9780079039897...AlgebraISBN:9780079039897Author:CarterPublisher:McGraw Hill