
An Introduction to Statistical Methods and Data Analysis
7th Edition
ISBN: 9781305269477
Author: R. Lyman Ott, Micheal T. Longnecker
Publisher: Cengage Learning
expand_more
expand_more
format_list_bulleted
Videos
Textbook Question
Chapter 15.8, Problem 17E
Refer to Exercise 15.16.
- a. Describe how the varieties of plants and planting densities would be randomly assigned to the plots of land.
- b. Compute the relative efficiency of the randomized block design compared to a completely randomized design. Do you think it was necessary for the researchers to block on fields? Explain.
- c. During the summer months when the experiment was conducted, it was unusually hot, and the researcher decides to repeat the experiment during the next growing season. The researcher would like to use the same three fields, but this time he would like to plant celebrity plants on field 1, sunbeam on field 2, and trust on field 3. Explain to the researcher why this design may not be appropriate.
15.16 An agricultural experiment station is investigating the appropriate planting density for three commercial varieties of tomatoes: celebrity, sunbeam, and trust. The researcher decides to examine the effects of four planting densities: 5,20,35, and 50 thousand plants per hectare. The experiment station has three large fields that would be appropriate for the study. At each of the fields, 12 plots are prepared, and the 12 treatments are randomly assigned to the plots. A separate randomization is done at each of the three fields. The yield, in tons, from the 36 one hectare plots are given here.
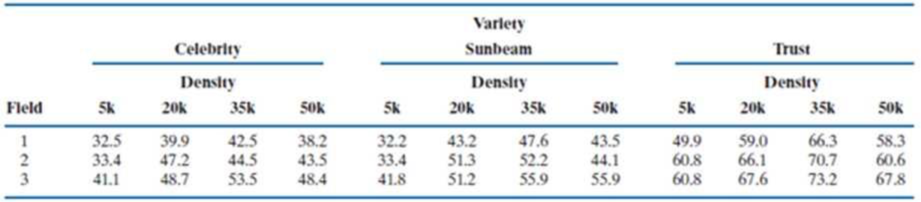
- a. Identify the design, and write a statistical model for this experiment.
- b. Use a profile plot to display the level of interaction between treatment and level.
- c. Perform appropriate F tests, and draw conclusions from these tests concerning the effect of variety and planting density on the mean yield of the tomato plants.
- d. Use a normal probability plot and a plot of the residuals to determine if there are violations in the appropriate conditions for validly drawing conclusions from the F tests.
Expert Solution & Answer
Want to see the full answer?
Check out a sample textbook solution
Chapter 15 Solutions
An Introduction to Statistical Methods and Data Analysis
Knowledge Booster


Learn more about
Need a deep-dive on the concept behind this application? Look no further. Learn more about this topic, statistics and related others by exploring similar questions and additional content below.Similar questions
Recommended textbooks for you
 Holt Mcdougal Larson Pre-algebra: Student Edition...AlgebraISBN:9780547587776Author:HOLT MCDOUGALPublisher:HOLT MCDOUGAL
 College Algebra (MindTap Course List)AlgebraISBN:9781305652231Author:R. David Gustafson, Jeff HughesPublisher:Cengage Learning
Holt Mcdougal Larson Pre-algebra: Student Edition...
Algebra
ISBN:9780547587776
Author:HOLT MCDOUGAL
Publisher:HOLT MCDOUGAL
College Algebra (MindTap Course List)
Algebra
ISBN:9781305652231
Author:R. David Gustafson, Jeff Hughes
Publisher:Cengage Learning
Hypothesis Testing using Confidence Interval Approach; Author: BUM2413 Applied Statistics UMP;https://www.youtube.com/watch?v=Hq1l3e9pLyY;License: Standard YouTube License, CC-BY
Hypothesis Testing - Difference of Two Means - Student's -Distribution & Normal Distribution; Author: The Organic Chemistry Tutor;https://www.youtube.com/watch?v=UcZwyzwWU7o;License: Standard Youtube License