Videos
(Optimal Provision of Public Goods) Using at least two individual consumers, show how the market
the market demand curve is to be derived from individual demand curves for a private goods and for a public good and then introduce the market supply curve and show the optimal level of production.
Concept Introduction:
A demand curve is a graph that shows the change in quantity demanded of a good or service with respect to its price. With change in price the demand also change and it carries an inverse relationship with the price. Market demand refers to the demand of a good in a particular market that adds up to a sum of different individual demands.
Explanation of Solution
Individual demand curves adds up to make a market demand curve for a good. It is a broader term that defines demand of a particular good at a much larger scale.
a. For a private good: Private good refers to the good that needs to be purchased from the private individual and its consumption by one individual prevents it to be consumed from the other individuals.
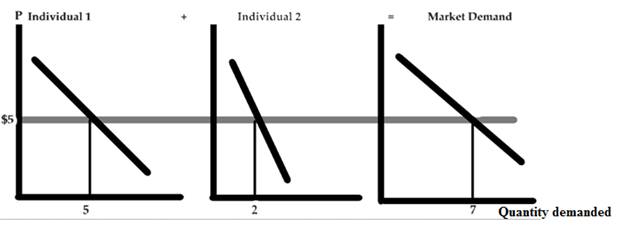
In the above figure there are three curves, where curve 1 is the individual demand curve for a good at price $5 and quantity 5 units. The second curve represents the individual demand curve for the same good at same price but the quantity is 2. The third curve is the market demand curve which is the summation of curve 1 of individual 1 and curve 2 of individual 2 at price $5 same as before. The market demand curve is the summation of curve 1 and curve 2 therefore the quantity for the same is 5 + 2 = 7 units.
b. For public good: A public good is a good which is provided to all the members of the society without profit, it is provided by the government, individual or an organization. The consumption of such good doesn’t affect the consumption for others.
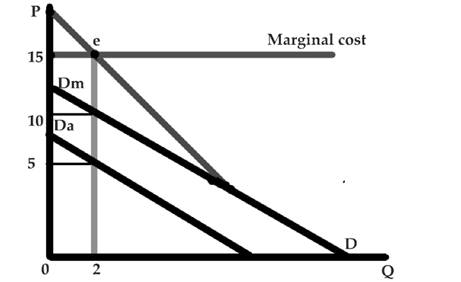
Public good once produced is available to all people and in identical amounts. Hence the demand for the public good is the vertical summation of each individuals demand. The marginal cost here equals the marginal benefits at e where the market demand curve and the marginal cost curve are at equilibrium. The red line on the graph represent the market demand curve and the blue line defines the marginal cost curve. Dm and Da are respectively the two individual demand curves which add up vertically with quantity being constant to make the market demand curve.
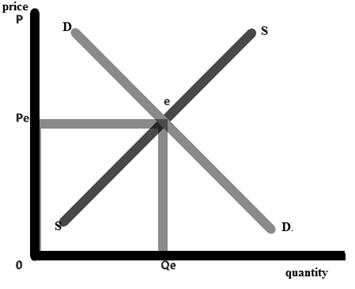
The market supply curve is an upward sloping curve which shows a positive relationship between the price and the quantity supplied. The summation of the individuals producers supply makes the market supply curve.
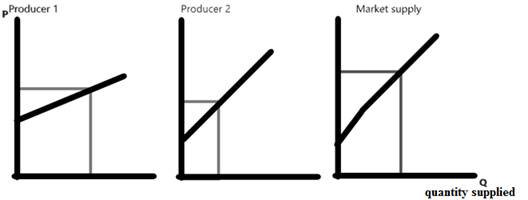
The optimal level of production is the point where the market demand is equal to that of the market supply and that level of intersection is called the market demand.
Want to see more full solutions like this?
Chapter 16 Solutions
ECON MICRO (with ECON MICRO Online, 1 term (6 months) Printed Access Card) (New, Engaging Titles from 4LTR Press)


- 7 Evaluate the different ways in which a government might be able to improve access to the housing market. Use relevant graphical analysis.arrow_forward14. Question 14 options: An entity formed between two or more parties to undertake economic activity together is known as --------------arrow_forward29- Government of UAE is exporting surplus Dates produced in the country. There are government initiatives to promote dates export from the country. These measures are taken by the government to_____. a. Encourage Date farmers in the country b. All of these c. Ensure fair income for date farmers in the country d. Generate export income for the countryarrow_forward
- 20 The opportunity cost of receiving $100 next year as opposed to getting $100 today is: the foregone interest that could be earned if you had the money today. the taxes paid on any earnings. the value of $100 relative to the total income of that person. the value of $100 relative to the total income of all persons.arrow_forward3.3. (Government Revenue) What are the sources of government revenue in the United States? Which types of taxes are most important at each level of government? Which two taxes provide the most revenue to the federal government?arrow_forward1. Jaynet spends $30,000 per year on painting supplies and storage space. She recently received a job offer from a famous marketing firm for $110,000. However, she turned the job offer down to continue a painting career. If Jaynet sells 25 paintings per year at a price of $8,000 each:What is the minimum amount that she would need to be offered to quit her painting career?arrow_forward
- 57. A family on a trip budgets $800 for restaurant meals and fast food. The price of a fast-food meal is $20 and the family can afford 16 restaurant meals if they don't buy any fast food. How many fast-food meals would the family gain if they gave up one restaurant meal? a. 1 b. 0.4 c. 2 d. 2.5 e. 5arrow_forward13. Which ones correctarrow_forward11-The selling price of a product in Oman is higher than the price in Dubai although both products are having the same nature. Customers are buying the product from Dubai due to the price differences. What will be the effect of the customers buying the products from Dubai? (1) Due to this, appreciation in the value AED (United Arab Emirates Dirham) relative to OMR, (2) Due to this, depreciate in the value AED (United Arab Emirates Dirham) relative to OMR, (3) Product sold in Oman market will decrease and the retail price will go down, (4) Product sold in Oman market will decrease and the retail price will go up, (5) The demand for the product and prices will increase in Dubai a. (2) and (3) only b. (1), (2), (3), (4) and (5) c. (1) and (2) only d. (1), (3) and (5) onlyarrow_forward
- 5 measures taken by the government of Cameroon to ensure the sustainability of minerals and energy resources in Cameroonarrow_forward4. Taking into account the relevant tax principles, critically discuss ways in which an organisation involved in international business can manage costs reduction and tax obligationsarrow_forward13 Can you help me solve this question? Thanks.arrow_forward

 Principles of Economics, 7th Edition (MindTap Cou...EconomicsISBN:9781285165875Author:N. Gregory MankiwPublisher:Cengage Learning
 Principles of Economics (MindTap Course List)EconomicsISBN:9781305585126Author:N. Gregory MankiwPublisher:Cengage Learning
 Principles of Microeconomics (MindTap Course List)EconomicsISBN:9781305971493Author:N. Gregory MankiwPublisher:Cengage Learning