Videos
ADDITIONAL FUNDS NEEDED Morrissey Technologies Inc.’s 2016 financial statements are shown here.
Morrissey Technologies Inc.: Balance Sheet as of December 31, 2016
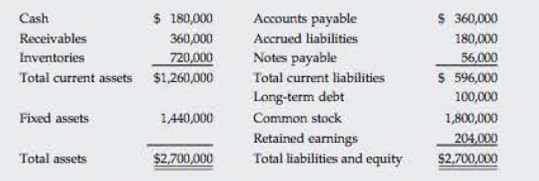
Morrissey Technologies Inc.: Income Statement for December 31, 2016
| Sales | $3,600,000 |
| Operating costs including depredation | 3,279,720 |
| EBIT | $ 320,280 |
| Interest | 20,280 |
| EBT | $ 300,000 |
| Taxes (40%) | 120,000 |
| Net Income | $ 180,000 |
| Per Share Data: | |
| Common stock price | $45.00 |
| Earnings per share (EPS) | $ 1.80 |
| Dividends per share (DPS) | $ 1.08 |
Suppose that in 2017, sales increase by 10% over 2016 sales. The firm currently has 100,000 shares outstanding. It expects to maintain its 2016 dividend payout ratio and believes that its assets should grow at the same rate as sales. The firm has no excess capacity. However, the firm would like to reduce its operating costs/sales ratio to 87.5% and increase its total liabilities-to-assets ratio to 30%. (It believes its liabilities-to-assets ratio currently is too low relative to the industry average.) The firm will raise 30% of the 2017 forecasted interest- bearing debt as notes payable, and it will issue long-term bonds for the remainder. The firm
- a. Construct the forecasted financial statements assuming that these changes are made. What are the firm’s forecasted notes payable and long-term debt balances? What is the forecasted addition to
retained earnings ? - b. If the profit margin remains at 5% and the dividend payout ratio remains at 60%, at what growth rate in sales will the additional financing requirements be exactly zero? In other words, what is the firm’s sustainable growth rate? (Hint: Set AFN equal to zero and solve for g.)
a.
To construct: The forecasted financial statements for the year 2017 and to calculate the firm’s forecasted notes payable and long-term debts balance and forecasted addition to retained earnings
Introduction:
Financial Statements:
Financial statements are the statements, which tell about the financial activities of the company. A financial statement of a company includes its income statement, balance sheet, and cash flows statement.
Income Statement:
Income statement is a business’s financial statement, which tells the financial performance of a company in an accounting period. It shows the income generated by a company and expenses incurred by a company through its operations.
Balance Sheet:
Balance sheet is the summarize statement of total assets and total liabilities of a company in an accounting period. It is one of the financial statements.
Additional Fund Needed:
Additional fund needed is also known as external financing needed. It is the state in which a company needed finance to increase its operation. Additional fund needed is a method in which a company raises the funds through external resources to increase its assets, which would increase the sales revenue of the firm.
But according to additional fund needed method, a company do not change its financial ratio. Liabilities and retained earnings spontaneously increase with the increase in sales and assets.
Explanation of Solution
| Company M | |
| Income Statement | |
| For the year ended December 31,2017 | |
| Particulars |
Amount ($) |
| Sales | 3,960,000 |
| Less:-Operating costs including depreciation | 3,465,000 |
| EBIT | 495,000 |
| Less:-Interest | 111,375 |
| EBT | 383,625 |
| Less:-Taxes | 153,450 |
| Net income | 230,175 |
| Per Share Data: | |
| Common stock price | 45 |
| Earnings per share (EPS) | 2.30 |
| Dividends per share (DPS) | 1.38 |
Table (1)
| Company M | ||
| Balance Sheet | ||
| For the year ended December 31, 2017 | ||
| Assets |
Amount ($) |
Amount ($) |
| Current assets: | ||
| Cash | 198,000 | |
| Accounts receivable | 396,000 | |
| Inventories | 792,000 | |
| Total current assets | 1,386,000 | |
| Fixed assets | 1,584,000 | |
| Total Assets | 2,970,000 | |
| Liabilities and Owners' Equity | ||
| Current Liabilities: | ||
| Notes payable | 728,000 | |
| Total current Liabilities | 728,000 | |
| Long-term debt | 163,000 | |
| Total Liabilities | 891,000 | |
| Owners' Equity: | ||
| Common stock | 1,782,930 | |
| Retained Earnings | 296,070 | |
| Total Stockholders' Equity | 2,079,000 | |
| Total Liabilities and Owners' Equity | 2,970,000 | |
Calculation of forecasted notes payable for 2017,
Given,
Notes payable for 2016 are $56,000.
Company will raise notes payable by 30%.
Formula to calculate the forecasted notes payable for 2017,
Substitute $560,000 for notes payable for 2016 and 30% for increment in notes payable.
Calculation of forecasted long term debts for 2017,
Given,
Liabilities (excluding retained earnings and common stock) for 2017 are $891,000 (working notes).
Notes payable for 2017 are $728,000.
Formula to calculate long term debts for 2017,
Substitute $891,000 for liabilities (excluding retained earnings and common stock) and $728,000 for notes payable.
Calculation of addition to retained earnings for the year 2017
Given,
Dividend paid for the year ended 2017 is $138,105.
Net income for the year ended is $230,175.
Formula to calculate addition to retained earnings,
Substitute $230,175 for net income and $138,105 for dividend paid.
Working notes:
Calculation of estimated sales for the year 2017
Given,
Sales for the year 2016 are $3,600,000.
Increment in sales is 10%.
Calculation of estimated sales for 2017,
Calculation of estimated operating costs including depreciation for the year 2017
Given,
The firm would like to reduce its operating cost/sales ratio to 87.5%.
Sales of the year 2017 are $3,960,000.
Calculation of operating costs including depreciation,
Calculation of estimated total assets for 2017,
Given,
Value of total assets for 2016 is $2,700,000.
The assets should grow at the same rate as sales, which is 10%.
Calculation of the total assets,
Calculation of estimated cash for 2017,
Given,
Value of cash for 2016 is $180,000.
The assets should grow at the same rate as sales, which is 10%.
Calculation of estimated cash for 2017,
Calculation of estimated receivable for 2017,
Given,
Value of receivable for 2016 is $360,000.
The assets should grow at the same rate as sales, which is 10%.
Calculation of estimated receivable for 2017,
Calculation of estimated inventories for 2017,
Given,
Value of inventories for 2016 is $720,000.
The assets should grow at the same rate as sales, which is 10%.
Calculation of estimated inventories for 2017,
Calculation of estimated fixed assets for 2017,
Given,
Fixed assets for 2016 are $1,440,000.
The assets should grow at the same rate as sales, which is 10%.
Calculation of estimated fixed assets for 2017,
Calculation of estimated total liabilities (excluding retained earnings and common stock) for 2017,
Given,
The liabilities-to-assets ratio for 2017 is 30%.
Estimated assets for 2017 are 2,970,000.
Calculation of estimated liabilities (excluding retained earnings and common stock) for 2017,
Calculation of estimated interest for 2017,
Given,
Forecasted notes payable for 2017 are $728,000.
Forecasted long terms debts are $891,000.
Interest rate is 12.5%.
Calculation of estimated interest,
Calculation of taxes
Given,
Tax rate is 40%
EBT for the year 2017 is $383,625.
Calculation of taxes,
Calculation of Earnings per share,
Given,
Estimated net income for 2017 is $230,175.
Shares outstanding are 100,000.
Calculation of EPS,
Calculation of dividend paid in 2016,
Given,
Dividend per share for 2016 is $1.08.
Shares outstanding for 2016 is 100,000
Formula to calculate Dividend paid in 2016,
Calculation of dividend payout ratio,
Given,
Dividend paid for the year 2016 is $108,000.
Net income for the year 2016 is $180,000.
Calculation of the dividend payout ratio,
Calculation of dividend paid during 2017
Given
Dividend payout ratio remains constant, which is 60%.
Net income for the year 2017 is $230,175.
Calculation of dividend paid during 2017,
Calculation of estimated dividend per share for 2017,
Given,
Dividend paid during 2017 is $138,105.
Shares outstanding are 100,000.
Calculation of dividend per share,
Calculation of estimated value of common stock for 2017,
Given,
Estimated total assets for 2017 are $2,970,000.
Estimated liabilities (excluding retained earnings and common stock) are $891,000
Estimated retained earnings for 2017 are $92,070.
Calculation of common stock for 2017,
The forecasted notes payable for 2017 are $728,000, the forecasted long term debts are $163,000 and the addition in retained earnings are 92,070.
b.
To find: Firm’s sustainable growth rate in sales.
Explanation of Solution
Calculation of sustainable growth rate,
Given,
The profit margin is 5%.
The dividend payout ratio is 60%.
Current sales for 2017 are $3,960,000.
Total assets for 2017 are $2,970,000.
Spontaneous current liability for 2017 is $891,000.
Formula to calculate sustainable growth rate in sales,
Substitute 5% (or 0.05) for profit margin, 6% (or 0.6) for payout ratio, $3,960,000 for current sales, $2,970,000 for total assets and $891,000 for spontaneous current liability.
The sustainable growth rate is 3.96%.
Want to see more full solutions like this?
Chapter 16 Solutions
Fundamentals of Financial Management, Concise, Loose-Leaf Version


- Long-Term Financing Needed At year-end 2018, Wallace Landscapings total assets were 2.17 million, and its accounts payable were 560,000. Sales, which in 2018 were 3.5 million, are expected to increase by 35% in 2019. Total assets and accounts payable are proportional to sales, and that relationship will be maintained. Wallace typically uses no current liabilities other than accounts payable. Common stock amounted to 625,000 in 2018, and retained earnings were 395,000. Wallace has arranged to sell 195,000 of new common stock in 2019 to meet some of its financing needs. The remainder of its financing needs will be met by issuing new long-term debt at the end of 2019. (Because the debt is added at the end of the year, there will be no additional interest expense due to the new debt.) Its net profit margin on sales is 5%, and 45% of earnings will be paid out as dividends. a. What were Wallaces total long-term debt and total liabilities in 2018? b. How much new long-term debt financing will be needed in 2019? [Hint: AFN New stock = New long-term debt.)arrow_forwardLONG-TERM FINANCING NEEDED At year-end 2019, total assets for Arrington Inc. were 1.8 million and accounts payable were 450,000. Sales, which in 2019 were 3.0 million, are expected to increase by 25% in 2020. Total assets and accounts payable are proportional to sales, and that relationship will be maintained; that is, they will grow at the same rate as sales. Arrington typically uses no current liabilities other than accounts payable. Common stock amounted to 500,000 in 2019, and retained earnings were 475,000. Arrington plans to sell new common stock in the amount of 130,000. The firms profit margin on sates is 5%; 35% of earnings will be retained. a. What were Arringtons total liabilities in 2019? b. How much new long-term debt financing will be needed in 2020? (Hint: AFN - New stock = New long-term debt.)arrow_forwardChasse Building Supply Inc. reported net cash provided by operating activities of $243,000, capital expenditures of $112,900, cash dividends of $35,800, and average maturities of long-term debt over the next 5 years of $122,300. What is Chasses free cash flow and cash flow adequacy ratio? a. $94,300 and 0.77, respectively c. $130,100 and 1.06, respectively b. $94,300 and 0.82, respectively d. $165,900 and 1.36, respectivelyarrow_forward
- CALCULATING THE WACC Here is the condensed 2016 balance sheet for Skye Computer Company (in thousands of dollars): 2016 Current assets 2,000 Net fixed assets 3,000 Total assets 5,000 Accounts payable and accruals 900 Short-term debt 100 Long-term debt 1,100 Preferred stock (10,000 shares) 250 Common stock (50,000 shares) 1.300 Retained earnings 1,350 Total common equity 52,650 Total liabilities and equity 5,000 Skyes earnings per share last year were 3.20. The common stock sells for 55.00, Last year's dividend (Do) was 2.10, and a flotation cost of 10% would be required to sell new common stock. Security analysts are projecting that the common dividend will grow at an annual rate of 9%. Skye's preferred stock pays a dividend of 3.30 per share, and its preferred stock sells for 30.00 per share. The firm's before-tax cost of debt is 10%, and its marginal tax rate is 35%. The firms currently outstanding 10% annual coupon rate, long-term debt sells at par value. The market risk premium is 5%, the risk-free rate is 6%, and Skyes beta is 1.516. The firms total debt, which is the sum of the companys short-term debt and Long-term debt, equals 1.2 million. a. Calculate the cost of each capital component, that is, the after-tax cost of debt, the cost of preferred stock, the cost of equity from retained earnings, and the cost of newly issued common stock. Use the DCF method to find the cost of common equity. b. Now calculate the cost of common equity from retained earnings, using the CAPM method. c. What is the cost of new common stock based on the CAPM? (Hint: Find the difference between rc and rs. as determined by the DCF method, and add that differential to the CAPM value for rs) d. If Skye continues to use the same market-value capital structure, what is the firms WACC assuming that (1) it uses only retained earnings for equity? (2) If it expands so rapidly that it must issue new common stock?arrow_forwardADDITIONAL FUNDS NEEDED Morrissey Technologies Inc.s 2019 financial statements are shown here. Morrissey Technologies Inc.: Balance Sheet as of December 31, 2019 Morrissey Technologies Inc.: Income Statement for December 31, 2019 Suppose that in 2020, sales increase by 10% over 2019 sales. The firm currently has 100,000 shares outstanding. It expects to maintain its 2019 dividend payout ratio and believes that its assets should grow at the same rate as sales. The firm has no excess capacity. However, the firm would like to reduce its operating costs/sales ratio to 87.5% and increase its total liabilities-to-assets ratio to 30%. (It believes its liabilities-to-assets ratio currently is too low relative to the industry average.) The firm will raise 30% of the 2020 forecasted interest-bearing debt as notes payable, and it will issue long-term bonds for the remainder. The firm forecasts that its before-tax cost of debt (which includes both short- and long-term debt) is 12.5%. Assume that any common stock issuances or repurchases can be made at the firms current stock price of 45. a. Construct the forecasted financial statements assuming that these changes are made. What are the firms forecasted notes payable and long-term debt balances? What is the forecasted addition to retained earnings? b. If the profit margin remains at 6.25% and the dividend payout ratio remains at 60%, at what growth rate in sales will the additional financing requirements be exactly zero? In other words, what is the firms sustainable growth rate? (Hint: Set AFN equal to zero and solve for g.)arrow_forwardHome Depot entered fiscal 2017 with a total capitalization of $21,904 million. In 2017, debt investors received interest income of $877 million. Net income to shareholders was $8,654 million. (Assume a tax rate of 21%.) Calculate the economic value added assuming its cost of capital is 10%. (Do not round intermediate calculations. Enter your answer in millions rounded to 2 decimal places.)arrow_forward
- 10... Marigold Corporation reported net income of $49,400 in 2020. Depreciation expense was $16,700. The following working capital accounts changed. Accounts receivable $11,500 increase Available-for-sale debt securities 17,000 increase Inventory 8,000 increase Nontrade note payable 15,600 decrease Accounts payable 11,500 increase Compute net cash provided by operating activities. (Show amounts that decrease cash flow with either a - sign e.g. -15,000 or in parenthesis e.g. (15,000).) Marigold CorporationStatement of Cash Flows (Partial) $ Adjustments to reconcile net income to…arrow_forwardHome Depot entered fiscal 2017 with a total capitalization of $21,907 million. In 2017, debt investors received an interest income of $878 million. Net income to shareholders was $8,657 million. (Assume a tax rate of 21%.) Calculate the economic value-added assuming its cost of capital is 10%arrow_forwardFlint Corporation reported net income of $47,200 in 2020. Depreciation expense was $17,000. The following working capital accounts changed. Accounts receivable $10,200 increase Available-for-sale debt securities 15,900 increase Inventory 6,900 increase Nontrade note payable 13,500 decrease Accounts payable 12,300 increase Compute net cash provided by operating activities. (Show amounts that decrease cash flow with either a - sign e.g. -15,000 or in parenthesis e.g. (15,000).)arrow_forward
 Fundamentals of Financial Management, Concise Edi...FinanceISBN:9781305635937Author:Eugene F. Brigham, Joel F. HoustonPublisher:Cengage Learning
 Fundamentals of Financial Management (MindTap Cou...FinanceISBN:9781285867977Author:Eugene F. Brigham, Joel F. HoustonPublisher:Cengage Learning
 Fundamentals of Financial Management, Concise Edi...FinanceISBN:9781285065137Author:Eugene F. Brigham, Joel F. HoustonPublisher:Cengage Learning
 Fundamentals Of Financial Management, Concise Edi...FinanceISBN:9781337902571Author:Eugene F. Brigham, Joel F. HoustonPublisher:Cengage Learning
 Intermediate Financial Management (MindTap Course...FinanceISBN:9781337395083Author:Eugene F. Brigham, Phillip R. DavesPublisher:Cengage Learning