Concept explainers
To fill:
The blanks in the given figure.
Introduction:
Extinction vortex is a model that helps the ecologists, biologists, and geneticists to determine the reason for the extinction of the species. This model reveals the causes that lead to the vulnerability of the small populations, as they spiral toward the extinction. This model was developed by M. E. Gilpin and M. E Soule in 1986.
Answer to Problem 1LTB
The figure below is labeled as:

Explanation of Solution
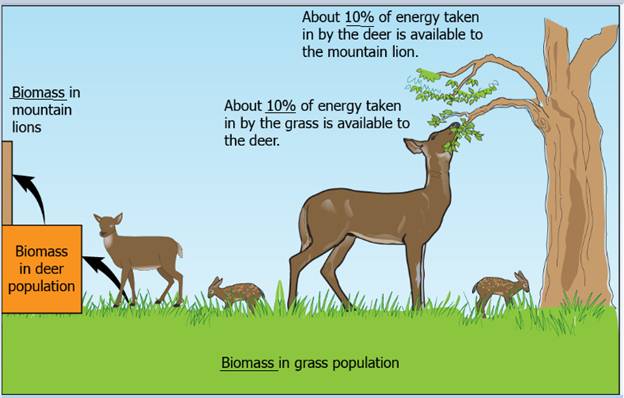
The given figures are the depiction of a graph which determines the amount of biomass of grass population transferred to mountain lions. The grass is an autotroph and makes its own food by the help of photosynthesis. When deer eat this grass, then only 10% of the energy in the grass is transferred to the deer. Further, when the lion eats the deer, then again, only 10% of the energy taken by the deer is transferred to the mountain lion.
The figure below is labeled as:
Want to see more full solutions like this?
Chapter 16 Solutions
EBK BIOLOGY


- Which of the following methods will provide information to an ecologist about both the size and density of a population? a. mark and recapture b. mark and release c. quadrat d. life tablearrow_forwardPopulation _______________ is the number of individuals of a species per unit of habitat area or volume at a given time. (a) dispersion (b) density (c) survivorship (d) age structure (e) demographicsarrow_forwardThe demographic transition model predicts a decline in population during the ________stage a. preindustrial c. industrial b. transitional d. postindustrialarrow_forward
- The per capita growth rate of a population where dispersal is not a factor is expressed as (a) i + e (b) b d (c) dN/dt (d) rN(K N) (e) (K N) Karrow_forwardDescribe the mechanisms by which human population growth and resource use causes increased extinction rates.arrow_forwardThe population size of a species capable of being supported by the environment is called its ________. a. limit b. carrying capacity c. biotic potential d. logistic growth patternarrow_forward
- Give typing answer with explanation and conclusion 1. Which of the following is most likely to increase the carrying capacity of an area for an organism? Choose ALL that apply A. Creating a migration corridor between patches of suitable habitat B. Harvesting the organism to reduce the population C. Eliminating a disease from the area D. Food source increases E. Climate change causing a mutualist to migrate out of the habitatarrow_forwardEnvironments with low frequency and intensity of disturbance tend to have ________ species diversity because ______. Group of answer choices A) low; the best competitors exclude any other species B) high; disturbances kill off a large number of individuals C) low; there are fewer late-successional species than early-successional species D) high; more species can colonize over a longer period of time Question: Answer choice selection is either: Burkina Faso or Italy for all three answer choicesarrow_forwardIf the slope on a rank abundance curve is m = 0, the species diversity in the community will be? Group of answer choices equal high more information needed lowarrow_forward
- Use the logistic equation to estimate population size two generations (Nt+2) after a population was counted as having 1,000 individuals (=N0), with a carrying capacity = 5,000 and r = 0.3 The subject is ecology.arrow_forwardIn your region, what species are threatened with extinction? Why are they vulnerable? Suggest steps that could be taken to increase their populations.arrow_forwardPlot a survivorship curve for a species with high rates ofpredation early in life and one for a species with high mortalitylate in life. Name the types of survivorship these speciesdisplayarrow_forward
 Concepts of BiologyBiologyISBN:9781938168116Author:Samantha Fowler, Rebecca Roush, James WisePublisher:OpenStax College
 Biology (MindTap Course List)BiologyISBN:9781337392938Author:Eldra Solomon, Charles Martin, Diana W. Martin, Linda R. BergPublisher:Cengage Learning