
Videos
a.
To explain:The data represented in the complete table is a function or not.
a.
Answer to Problem 20HP
The complete table is provided below,
The data in the table represents the function.
Explanation of Solution
Given information:
The table,
Formula used:
A relation is said to be a function if every element of domain is mapped to exactly one element of range.
Calculation:
Consider the table,
Here the x represent the number that is square of a whole number.
And y represent the positive square root of the number x .
So, square root of 4 is 2, 9 is 3, 16 is 4 and 36 is 6.
Also square of 5 is 25. Therefore, complete table is.
Recall that relation is said to be a function if every element of domain is mapped to exactly one element of range.
The elements of domain are
Each member of domain is mapped to exactly one element of range. Therefore, it represent a function.
b.
To graph: The
b.
Explanation of Solution
Given information:
The data is provided below.
Graph:
When the relationship between two data sets is to be analyzed scatter plot is used.
Provided two data sets. Here the x represent the number that is square of a whole number.
And y represent the positive square root of the number x .
On the x -axis of coordinate plane denote the number from 1 to 40.
On y -axis plot denote the number from 1 to 6.
The scatter plot of the data is provided below,
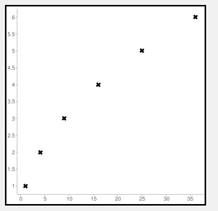
Interpretation:
It is observed as the square of whole number increases its square root value also increases that is there is a strong positive linear relationship between x and y .
c.
To explain:The data represented in the complete table when the x and y coordinates are revered is a function or not.
c.
Answer to Problem 20HP
The complete table is provided below,
The data in the table represents the function.
Explanation of Solution
Given information:
The table,
Formula used:
A relation is said to be a function if every element of domain is mapped to exactly one element of range.
Calculation:
Consider the table,
Here the x represent the number that is square of a whole number.
And y represent the positive square root of the number x .
Now, reverse the x and y coordinates.
So, square root of 4 is 2, 9 is 3, 16 is 4 and 36 is 6.
Also square of 5 is 25. Therefore, complete table is.
Recall that relation is said to be a function if every element of domain is mapped to exactly one element of range.
The elements of domain are
Each member of domain is mapped to exactly one element of range. Therefore, it represent a function.
d.
To graph: The scatter plot between whole number and square value of the whole number.
d.
Explanation of Solution
Given information:
The data is provided below.
Graph:
When the relationship between two data sets is to be analyzed scatter plot is used.
Provided two data sets. Here the x represent the whole number.
And y represent the square value of the number x .
On the x -axis of coordinate plane denote the number from 1 to 6.
On y -axis plot denote the number from 1 to 40.
The scatter plot of the data is provided below,
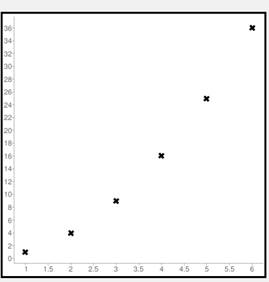
Interpretation:
It is observed as the whole number increases its square value also increases that is there is a strong positive linear relationship between x and y .
Chapter 1 Solutions
Pre-Algebra Student Edition
Additional Math Textbook Solutions
College Algebra
Elementary Algebra
Linear Algebra and Its Applications (5th Edition)
College Algebra (7th Edition)


 Algebra and Trigonometry (6th Edition)AlgebraISBN:9780134463216Author:Robert F. BlitzerPublisher:PEARSON
 Contemporary Abstract AlgebraAlgebraISBN:9781305657960Author:Joseph GallianPublisher:Cengage Learning
 Linear Algebra: A Modern IntroductionAlgebraISBN:9781285463247Author:David PoolePublisher:Cengage Learning
 Algebra And Trigonometry (11th Edition)AlgebraISBN:9780135163078Author:Michael SullivanPublisher:PEARSON
 Introduction to Linear Algebra, Fifth EditionAlgebraISBN:9780980232776Author:Gilbert StrangPublisher:Wellesley-Cambridge Press
 College Algebra (Collegiate Math)AlgebraISBN:9780077836344Author:Julie Miller, Donna GerkenPublisher:McGraw-Hill Education