
Videos
B. Thomas Testing Labs
John Thomas, the owner of Thomas Testing, has for some time done contract work for insurance companies regarding drunk driving. To improve his research capabilities, he recently purchased the Rupple Driving Simulator. This device will allow a subject to take a “road test” and provide a score indicating the number of driving errors committed during the test drive. Higher scores indicate more driving errors. Driving errors would include not coming to a complete stop at a stop sign, not using turning signals, not exercising caution on wet or snowy pavement, and so on. During the road test, problems appear at random and not all problems appear in each road test. These are major advantages to the Rupple Driving Simulator because subjects do not gain any advantage by taking the test several times.
With the new driving simulator, Mr. Thomas would like to study in detail the problem of drunk driving. He begins by selecting a random sample of 25 drivers. He asks each of the selected individuals to take the test drive on the Rupple Driving Simulator. The number of errors for each driver is recorded. Next, he has each of the individuals in the group drink three 16-ounce cans of beer in a 60-minute period and return to the Rupple Driving Simulator for another test drive. The number of driving errors after drinking the beer is also shown. The research question is: Does alcohol impair the driver’s ability and, therefore, increase the number of driving errors?
Mr. Thomas believes the distribution of scores on the test drive does not follow a
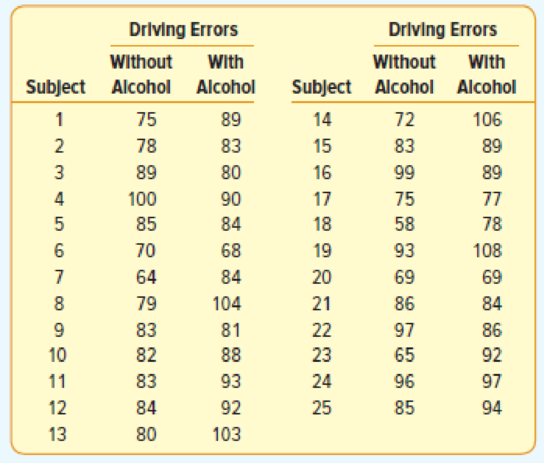
- a. Compare the results using these two procedures. Conduct an appropriate test of hypothesis to determine if alcohol is related to driving errors.
- b. Write a report that summarizes your findings.
Want to see the full answer?
Check out a sample textbook solution
Chapter 16 Solutions
STATISTICAL TECHNIQUES-ACCESS ONLY


- The variable with the largest positive Pj – Zj value is the a. artificial variable b. entering variable c. slack variable d leaving variablearrow_forwardZhou and Vohs (2009) published a study showing that handling money reduces the perception pain. In the experiment, a group of college students was told that they were participating in a manual dexterity study. Half of the students were given a stack of money to count and the other half got a stack of blank pieces of paper. After the counting task, the participants were asked to dip their hands into bowls of very hot water (122 degrees) and rate how uncomfortable it was. The following data show ratings of pain similar to the results obtained in the study. Is there a significant difference in reported pain between the two conditions? Use a two-tailed test with alpha= .05 Counting Money Counting Paper 7 9 8 11 10 13 6 10 8 11 5 9 7 15 12 14 5 10 1.State the hypothesis a.H0: b.H1: 2. Locate the critical region a.df = b.The critical value of t = 3.Compute the statistic a.Pooled variance (s2p) = b.standard error (sM-M) = c.t = d. Cohen's d = e.r2= f. Confidence…arrow_forwardNeed helparrow_forward
- A companies HR manager has noticed that they are not retaining their talent. The HR manager believes that he can tell you why employees are leaving without using analytics. What methods would the HR manager apply that would give him the ability to determine this without using analytics? Should analytics be used to explain this? What type of analytics would you use in order to pinpoint where the problem is?arrow_forwardDr. Wong has a table of data in her veterinary office that shows the average lifespan and weight of several popular dog breeds. Alfonso made a scatterplot of these data for a math project. Answer the following questions to make predictions about the lifespan of a specfic breed of dog. 1. Describe the association shown by this scatterplot. 2. Alfonso is thinking of getting a bloodhound. Bloodhounds usually weight about 90 pounds. Based on the data, estimate the lifespan of a bloodhound. Explain how you made this estimate. 3. Alfonso's friend Dani tells Alfonso that her bloodhound, Ol' Sniffy, lived to be 14. Based on what is known, do you think this is because --- A. Alfonso didn't use a good estimation method. B. Dani doesn't remember Ol' Sniffy's age correctly C. Ol' Sniffy lived an unsually long time. *I need all parts answered please, 1-3. Use the image to help. FOR AN EXPERIMENT!!! NOT FOR A GRADE > this is due in a couple of hours!!arrow_forwardIn this assignment, you will calculate the relative risk, attributable risk, and number needed to treat for a contrived clinical research study. In the study, researchers want to determine whether a new drug will reduce the risk of blood clotting in patients who have been diagnosed with blood clots in the past. 2,000 participants were selected for the study. 1,000 participants were given the new drug, and 1,000 participants were given a placebo. After 5 years, the number of participants from each group who had developed a blood clot were recorded. The data is shown in the table below. 1. Calculate the RR, ARR, and NNT for the data. 2. Briefly interpret each value in your own words. Blood clot No blood clot Total New drug 21 979 Placebo 45 955 Totalarrow_forward
- Teacher of a class wants to study the reasons for students' absence. What is needed for her to study? a. Organize the data and analyze it b. Collect the data on the students' absence c. Investigate the reasons and draw conclusion d. All the abovearrow_forwardCritics of television often refer to the detrimental effects that all the violence shown ontelevision has on children. However, there may be another problem. It may be thatwatching television also reduces the amount of physical exercise, causing weight gains. Asample of 15 10-year-old children was taken. The number of pounds each child wasoverweight was recorded (a negative number indicates the child is underweight). Inaddition, the number of hours of television viewing per week was also recorded. Thesedata are listed here.Television 42 34 25 35 37 38 31 33Overweight 18 6 0 −1 13 14 7 7Television 19 29 38 28 29 36 18Overweight −9 8 8 5 3 14 −7a) Draw the scatter diagram.b) Calculate the sample regression line and describe what the coefficients tell youabout the relationship between the two variables.arrow_forwardAnswer letter c (It's not for a grade).arrow_forward
- What do people actually order at Chipotle? How healthy is a normal Chipotle meal? Chipotle and other relatively new healthier menu choices than the traditional fast food outlets like McDonald's, Taco Bell, Burger King, etc. fast casual chains like Shake Shack, Potbelly and Five Guys typically promote themselves as having The recommended daily calorie intake for most adults is 1,600 to 2,400. The histogram below shows the calories in approximately 3,000 meals ordered from Chipotle on Grubhub. Many burritos and burrito bowls end up with 900 to 1,000 calories. Recommended dietary allowance 2,000 calories 6% of meals 5% This small bump is 4% mostly from sides of chips and guacamole. 3% 2% About 2 percent of meals had more than 2,000 calories. 1% 200 400 600 800 1,000 1,200 1,400 1,600 1,800 2,000 2,200 2,400 2,600 2,800 While the histogram not perfectly symmetric (there is mild right skewness), it is close enough to being symmetric and bell-shaped to justify using the 68-95-99.7 rule.…arrow_forwardWhat is the answer and solution to this question? Thanks.arrow_forwardNeed help with this problem. It is believed that large doses of acetaminophen (the activeingredient in over the counter pain relievers like Tylenol) may cause damage to the liver. A researcherwants to conduct a study to estimate the proportion of acetaminophen users who have liver damage. Forparticipating in this study, he will pay each subject $20 and provide a free medical consultation if the patienthas liver damage.(a) If he wants to limit the margin of error of his 98% confidence interval to 2%, what is the minimumamount of money he needs to set aside to pay his subjects?(b) The amount you calculated in part (a) is substantially over his budget so he decides to use fewer subjects.How will this affect the width of his confidence interval?arrow_forward
 Glencoe Algebra 1, Student Edition, 9780079039897...AlgebraISBN:9780079039897Author:CarterPublisher:McGraw Hill
 Holt Mcdougal Larson Pre-algebra: Student Edition...AlgebraISBN:9780547587776Author:HOLT MCDOUGALPublisher:HOLT MCDOUGAL
 Big Ideas Math A Bridge To Success Algebra 1: Stu...AlgebraISBN:9781680331141Author:HOUGHTON MIFFLIN HARCOURTPublisher:Houghton Mifflin Harcourt