
Concept explainers
Interpretation: The control over production process is to be assessed using the
Concept Introduction:
Answer to Problem 2CSQD
The mean and range values are well within the control limits as seen from the x bar and R charts. Hence, the production process is in control.
Explanation of Solution
Given information:
 The
The
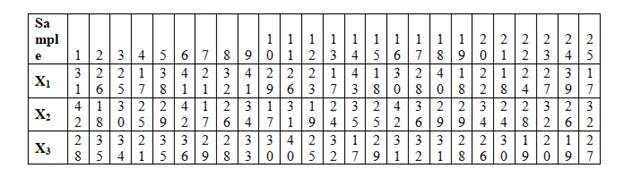
The sample mean and range are calculated and shown below:
| Sample | X1 | X2 | X3 | Sample mean(X1+X2+X3)/3 | Sample Range |
| 1 | 31 | 42 | 28 | 33.67 {(31+42+28)/3=33.67} | 14 |
| 2 | 26 | 18 | 35 | 26.33 | 17 |
| 3 | 25 | 30 | 34 | 29.67 | 9 |
| 4 | 17 | 25 | 21 | 21.00 | 8 |
| 5 | 38 | 29 | 35 | 34.00 | 9 |
| 6 | 41 | 42 | 36 | 39.67 | 6 |
| 7 | 21 | 17 | 29 | 22.33 | 12 |
| 8 | 32 | 26 | 28 | 28.67 | 6 |
| 9 | 41 | 34 | 33 | 36.00 | 8 |
| 10 | 29 | 17 | 30 | 25.33 | 13 |
| 11 | 26 | 31 | 40 | 32.33 | 14 |
| 12 | 23 | 19 | 25 | 22.33 | 6 |
| 13 | 17 | 24 | 32 | 24.33 | 15 |
| 14 | 43 | 35 | 17 | 31.67 | 26 |
| 15 | 18 | 25 | 29 | 24.00 | 11 |
| 16 | 30 | 42 | 31 | 34.33 | 12 |
| 17 | 28 | 36 | 32 | 32.00 | 8 |
| 18 | 40 | 29 | 31 | 33.33 | 11 |
| 19 | 18 | 29 | 28 | 25.00 | 11 |
| 20 | 22 | 34 | 26 | 27.33 | 12 |
| 21 | 18 | 24 | 30 | 24.00 | 12 |
| 22 | 24 | 28 | 19 | 23.67 | 9 |
| 23 | 27 | 32 | 20 | 26.33 | 12 |
| 24 | 39 | 26 | 19 | 28.00 | 20 |
| 25 | 17 | 32 | 27 | 25.33 | 15 |
| Total | 710.67 | 296 | |||
| Average | 28.43 | 11.84 |
From the 3-sigma standard control chart, the coefficient values are obtained as follows:
And the control limits are calculated
The
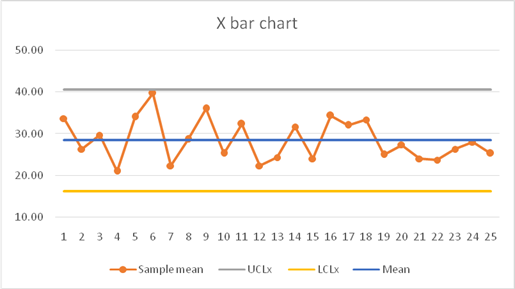
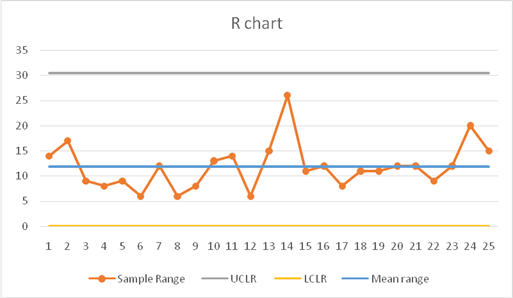
The mean and range values are well within the control limits and hence the process is in control.
Want to see more full solutions like this?
Chapter 16 Solutions
OM (with OM Online, 1 term (6 months) Printed Access Card)


- Describe the 5 steps to follow while using control charts?arrow_forwardCheckout time at a supermarket is monitored using a mean and a range chart. Six samples of n = 20 observations have been obtained and the sample means and ranges computed: Sample Mean Range Sample Mean Range 1 3.06 .42 4 3.13 .46 2 3.15 .50 5 3.06 .46 3 3.11 .41 6 3.09 .45 a. Using the factors in Table 10.3 , determine upper and lower limits for mean and range charts. b. Is the process in control?arrow_forwardP-chart and c-chart. Using the appropriate control chart, determine two-sigma controllimits for each Problem case, a. An inspector found an average of 3.9 scratches in the exterior paint of each of theautomobiles being prepared for shipment to dealers. b. Before shipping lawnmowers to dealers, an inspector attempts to start each mowerand notes any that do not start on the first try. The lot size is 100 mowers, and anaverage of 4 did not start (4 percent).arrow_forward
- What is the significance of the order of observation in process control?arrow_forwardExplain how to construct process control chart and use them to determine whether a process is out of statistical control?arrow_forwardDistinguish variable and attribute data. What types of control charts are used for each? Explain with examples related to healthcare.arrow_forward
- McDaniel Shipyards wants to develop control charts to assess the quality of its steel plate. They take ten sheets of 1" steel plate and compute the number of cosmetic flaws on each roll. Each sheet is 20' by 100'. Based on the following data, develop limits for the control chart, plot the control chart, and determine whether the process is in control. Sheet Number of flaws 1 1 2 1 3 2 4 0 5 1 6 5 7 0 8 2 9 0 10 2arrow_forwardWebster Chemical Company produces mastics and caulkingfor the construction industry. The product is blended inlarge mixers and then pumped into tubes and capped.Management is concerned about whether the filling processfor tubes of caulking is in statistical control. The processshould be centered on 8 ounces per tube. Several samplesof eight tubes were taken, each tube was weighed, and theweights in Table 3.3 were obtained. a. Assume that only six samples are sufficient and developthe control charts for the mean and the range.b. Plot the observations on the control chart and commenton your findings.arrow_forwardSelect three service companies or organizations you arefamiliar with and indicate how process control charts couldbe used in each.arrow_forward
 Practical Management ScienceOperations ManagementISBN:9781337406659Author:WINSTON, Wayne L.Publisher:Cengage,
 Operations ManagementOperations ManagementISBN:9781259667473Author:William J StevensonPublisher:McGraw-Hill Education
 Operations and Supply Chain Management (Mcgraw-hi...Operations ManagementISBN:9781259666100Author:F. Robert Jacobs, Richard B ChasePublisher:McGraw-Hill Education
 Purchasing and Supply Chain ManagementOperations ManagementISBN:9781285869681Author:Robert M. Monczka, Robert B. Handfield, Larry C. Giunipero, James L. PattersonPublisher:Cengage Learning
 Production and Operations Analysis, Seventh Editi...Operations ManagementISBN:9781478623069Author:Steven Nahmias, Tava Lennon OlsenPublisher:Waveland Press, Inc.