
Concept explainers
Videos
a.
State whether there is a difference in the maintenance cost for the four bus capacities.
a.
Answer to Problem 43DA
There is no evidence to support the claim that there is a difference in the maintenance cost for the four bus capacities.
Explanation of Solution
In this context, it is assumed that the maintenance costs are not
Therefore, it is appropriate to use Kruskal‑Wallis test.
The test hypothesis is given as follows:
Null hypothesis:
Alternative hypothesis:
Here, the test statistic H follows the chi-square distribution with
In order to formulate the decision rule, the chi-square is used.
In this context, the number of populations is 4.
Degrees of freedom for populations:
Procedure to obtain the critical value using Appendix B, Table B.7 the critical values of chi-square:
- 1. In the table, first locate 3 in the first z column.
- 2. Locate the value of 0.05 in the second row.
- 3. Locate the value, by the intersection of the row and column values give the critical value.
The critical value for 3 df for the 0.05 significance level is 7.815.
Decision rule:
- If
- Otherwise, fail to reject the null hypothesis.
In this context, the test statistic for Kruskal–Wallis test is denoted as H.
Test statistic, H:
Where, k is the number of populations.
n is the combined number of observations for all samples.
Step-by-step procedure to obtain Kruskal‑Wallis test using MINITAB is given below:
- Choose Stat > Non-parametric > Kruskal-Wallis.
- In Response, enter the column of Maintencecost.
- In Factor, enter the column of Capacity.
- Click OK.
Output obtained using MINITAB is given below:
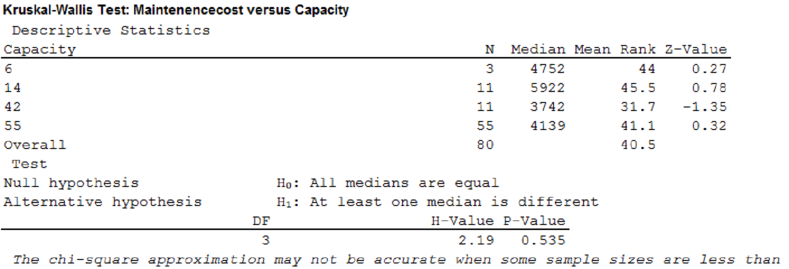
From the output, the test statistic is 2.19.
Conclusion:
Here, the test statistic is less than the critical value.
Therefore, by the decision rule, fail to reject the null hypothesis.
Therefore, there is no evidence to support the claim that there is a difference in the maintenance cost for the four bus capacities.
b.
State whether there is a difference between two populations.
b.
Answer to Problem 43DA
There is no difference between two populations.
Explanation of Solution
In this context, 1st population has 15 observations and 2nd population has 15 observations and the significance level is 0.05.
The test hypothesis is given as follows:
Null hypothesis:
Alternative hypothesis:
Decision rule:
- If
- Otherwise, fail to reject the null hypothesis.
In this context, the critical value for
The test statistic will be obtained under the following two categories:
Here,
W is the sum of ranks from the first population.
Step-by-step procedure to obtain test statistic using MegaStat is given below:
- Choose MegaStat > Nonparametric Tests > Wilcoxon – Mann/Whitney Test.
- In Group 1, enter the range of first population.
- In Group 2, enter the range of second population.
- Check the Output ranked data, Correct for ties, and Continuity correction and Select the Alternative.
- Click OK.
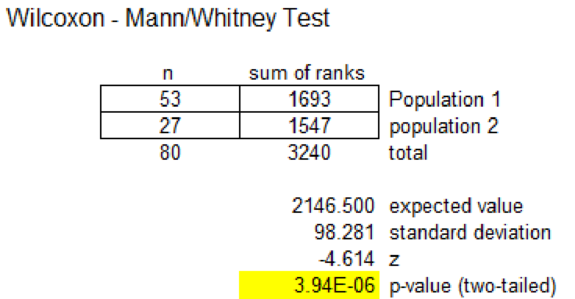
From the output, the test statistic value is –4.614.
Conclusion:
Here, the test statistic is less than the critical value
Therefore, by the decision rule, reject the null hypothesis.
Therefore, there is enough evidence to support the claim that the two populations are different.
c.
State whether there is a difference in the maintenance cost for the three manufacturers.
c.
Answer to Problem 43DA
There is no evidence to support the claim that there is a difference in the maintenance cost for the three manufacturers.
Explanation of Solution
In this context, it is assumed that the maintenance costs are not normally distributed.
Therefore, it is appropriate to use the Kruskal‑Wallis test.
The test hypothesis is given as follows:
Null hypothesis:
Alternative hypothesis:
In this context, the number of populations is 3.
Degrees of freedom for populations:
Procedure to find the critical value using Appendix B, Table B.7 the critical values of chi-square:
- In the table, first locate 2 in the first z column.
- Locate the value of 0.05 in the second row.
- Locate the value by the intersection of the row and column values, which give the critical value.
The critical value for 2 df for the 0.05 significance level is 5.991.
Decision rule:
- If
- Otherwise, fail to reject the null hypothesis.
In this context, the test statistic for Kruskal–Wallis test is denoted as H.
Step-by-step procedure to obtain the Kruskal-Wallis test using MINITAB is given below:
- Choose Stat > Non-parametric > Kruskal-Wallis.
- In Response, enter the column of Maintencecost.
- In Factor, enter the column of Manufacturer.
- Click OK.
Output obtained using MINITAB is given below:
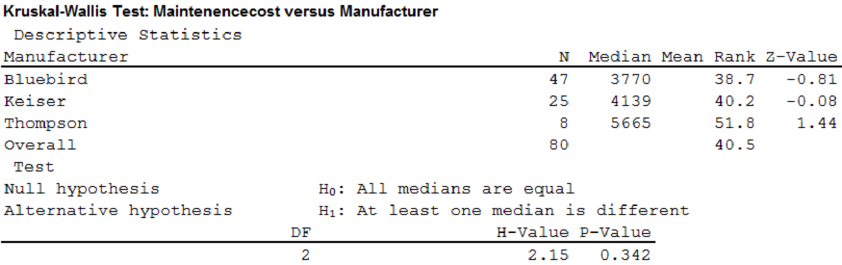
From the output, the test statistic is 2.15.
Conclusion:
Here, the test statistic is less than the critical value.
Therefore, by the decision rule, fail to reject the null hypothesis.
Therefore, there is no evidence to support the claim that there is a difference in the maintenance cost for the three manufacturers.
Want to see more full solutions like this?
Chapter 16 Solutions
STATISTICAL TECHNIQUES FOR BUSINESS AND


 Glencoe Algebra 1, Student Edition, 9780079039897...AlgebraISBN:9780079039897Author:CarterPublisher:McGraw Hill