
INTRODUCTION TO STATISTICS & DATA ANALYS
6th Edition
ISBN: 9780357420447
Author: PECK
Publisher: CENGAGE L
expand_more
expand_more
format_list_bulleted
Concept explainers
Videos
Textbook Question
Chapter 16.3, Problem 24E
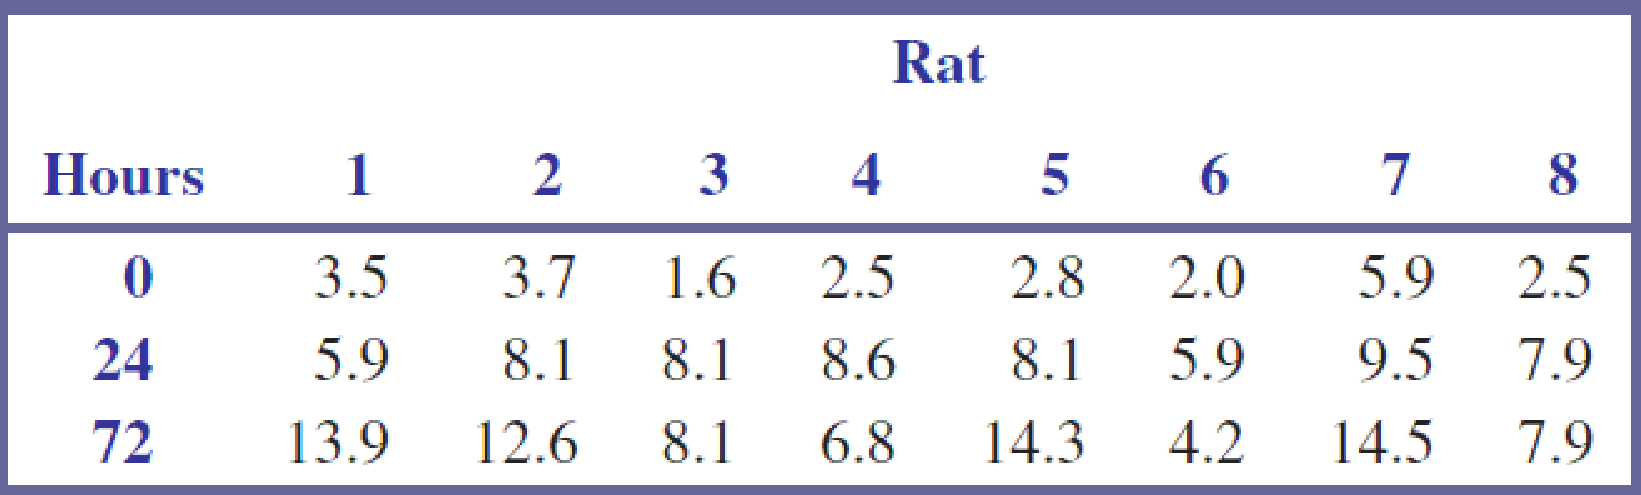
The following data on amount of food consumed (g) by eight rats after 0, 24, and 72 hours of food deprivation appeared in the paper “The Relation Between Differences in Level of Food Deprivation and Dominance in Food Getting in the Rat” (Psychological Science [1972]: 297–298). Do the data indicate a difference in the
Expert Solution & Answer

Trending nowThis is a popular solution!

Chapter 16 Solutions
INTRODUCTION TO STATISTICS & DATA ANALYS
Ch. 16.1 - Urinary fluoride concentration (in parts per...Ch. 16.1 - Prob. 2ECh. 16.1 - Prob. 3ECh. 16.1 - A blood lead level of 70 mg/ml has been commonly...Ch. 16.1 - The effectiveness of antidepressants in treating...Ch. 16.1 - Prob. 6ECh. 16.1 - Prob. 7ECh. 16.2 - The effect of a restricted diet in the treatment...Ch. 16.2 - Peak force (N) on the hand was measured just prior...Ch. 16.2 - In an experiment to study the way in which...
Ch. 16.2 - Prob. 11ECh. 16.2 - Prob. 12ECh. 16.2 - Prob. 13ECh. 16.2 - Prob. 14ECh. 16.2 - Prob. 15ECh. 16.2 - Prob. 16ECh. 16.2 - Prob. 17ECh. 16.2 - The signed-rank test can be adapted for use in...Ch. 16.3 - Prob. 19ECh. 16.3 - Prob. 20ECh. 16.3 - The given data on phosphorus concentration in...Ch. 16.3 - Prob. 22ECh. 16.3 - Prob. 23ECh. 16.3 - The following data on amount of food consumed (g)...Ch. 16.3 - The article Effect of Storage Temperature on the...
Knowledge Booster


Learn more about
Need a deep-dive on the concept behind this application? Look no further. Learn more about this topic, statistics and related others by exploring similar questions and additional content below.Recommended textbooks for you
 Glencoe Algebra 1, Student Edition, 9780079039897...AlgebraISBN:9780079039897Author:CarterPublisher:McGraw Hill
Glencoe Algebra 1, Student Edition, 9780079039897...
Algebra
ISBN:9780079039897
Author:Carter
Publisher:McGraw Hill
The Shape of Data: Distributions: Crash Course Statistics #7; Author: CrashCourse;https://www.youtube.com/watch?v=bPFNxD3Yg6U;License: Standard YouTube License, CC-BY
Shape, Center, and Spread - Module 20.2 (Part 1); Author: Mrmathblog;https://www.youtube.com/watch?v=COaid7O_Gag;License: Standard YouTube License, CC-BY
Shape, Center and Spread; Author: Emily Murdock;https://www.youtube.com/watch?v=_YyW0DSCzpM;License: Standard Youtube License