
APPLIED STAT.IN BUS.+ECONOMICS
6th Edition
ISBN: 9781259957598
Author: DOANE
Publisher: RENT MCG
expand_more
expand_more
format_list_bulleted
Videos
Textbook Question
Chapter 16.5, Problem 10SE
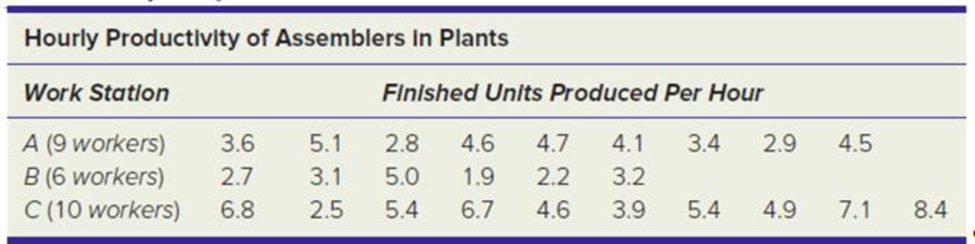
The results shown below are mean productivity measurements (average number of assemblies completed per hour) for a random sample of workers at each of three work stations. (a) At α = .05, is there a difference in median productivity? Use MegaStat, Minitab, or a similar computer package for the calculations. (b) Use one-factor ANOVA to compare the means. Do you reach the same conclusion? (c) Make a histogram or other display of the pooled data. Does the assumption of normality seem justified?
Expert Solution & Answer

Trending nowThis is a popular solution!

Chapter 16 Solutions
APPLIED STAT.IN BUS.+ECONOMICS
Ch. 16.2 - Prob. 1SECh. 16.2 - Prob. 2SECh. 16.2 - Prob. 3SECh. 16.2 - Prob. 4SECh. 16.3 - A sample of 28 student scores on the chemistry...Ch. 16.3 - Prob. 6SECh. 16.4 - Prob. 7SECh. 16.4 - Prob. 8SECh. 16.5 - Prob. 9SECh. 16.5 - The results shown below are mean productivity...
Ch. 16.6 - Consumers are asked to rate the attractiveness of...Ch. 16.6 - Prob. 12SECh. 16.7 - Prob. 13SECh. 16.7 - Prob. 14SECh. 16 - Prob. 1CRCh. 16 - Prob. 2CRCh. 16 - Prob. 3CRCh. 16 - Prob. 4CRCh. 16 - Prob. 5CRCh. 16 - Prob. 6CRCh. 16 - Prob. 7CRCh. 16 - Prob. 8CRCh. 16 - Prob. 9CRCh. 16 - Prob. 10CRCh. 16 - (a) Why is a significant correlation not proof of...Ch. 16 - Prob. 15CECh. 16 - Prob. 16CECh. 16 - Prob. 17CECh. 16 - Prob. 18CECh. 16 - Prob. 19CECh. 16 - Instructions: In all exercises, you may use a...Ch. 16 - Prob. 21CECh. 16 - Prob. 22CECh. 16 - Prob. 23CECh. 16 - Prob. 24CECh. 16 - Prob. 25CECh. 16 - Instructions: In all exercises, you may use a...Ch. 16 - Prob. 27CECh. 16 - Instructions: In all exercises, you may use a...Ch. 16 - Prob. 29CECh. 16 - Prob. 30CECh. 16 - Prob. 31CECh. 16 - Prob. 32CECh. 16 - Prob. 33CECh. 16 - Prob. 34CECh. 16 - Instructions: In all exercises, you may use a...Ch. 16 - Prob. 36CECh. 16 - Prob. 37CE
Knowledge Booster


Learn more about
Need a deep-dive on the concept behind this application? Look no further. Learn more about this topic, statistics and related others by exploring similar questions and additional content below.Recommended textbooks for you
 Glencoe Algebra 1, Student Edition, 9780079039897...AlgebraISBN:9780079039897Author:CarterPublisher:McGraw Hill
Glencoe Algebra 1, Student Edition, 9780079039897...
Algebra
ISBN:9780079039897
Author:Carter
Publisher:McGraw Hill
Hypothesis Testing using Confidence Interval Approach; Author: BUM2413 Applied Statistics UMP;https://www.youtube.com/watch?v=Hq1l3e9pLyY;License: Standard YouTube License, CC-BY
Hypothesis Testing - Difference of Two Means - Student's -Distribution & Normal Distribution; Author: The Organic Chemistry Tutor;https://www.youtube.com/watch?v=UcZwyzwWU7o;License: Standard Youtube License