
Concept explainers
Videos
PRINTED BY: 92248ddb24ccbc6@placeholder.10274.edu. Printing is for personal, private use only. No part of this book may be reproduced or transmitted without publisher's prior permission. Violators will be prosecuted.
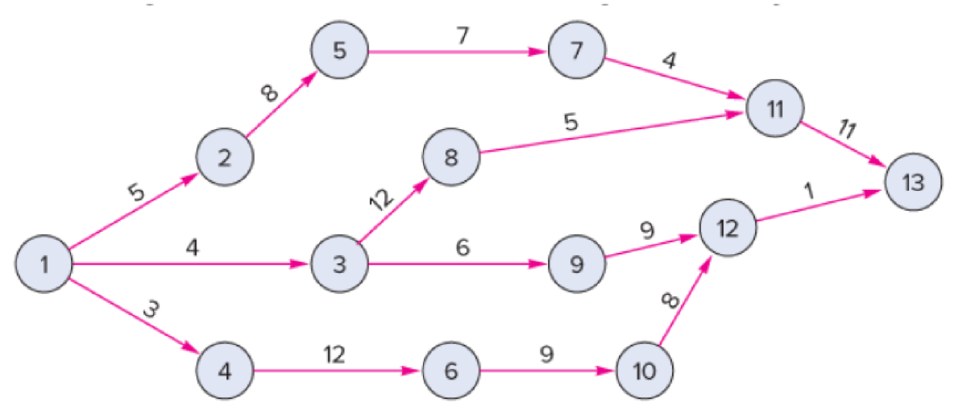
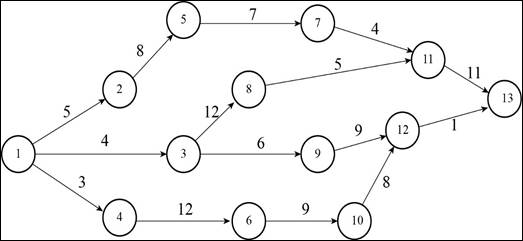
A construction project has indirect costs totaling $40,000 per week. Major activities in the project and their expected times in weeks are shown in this precedence diagram.
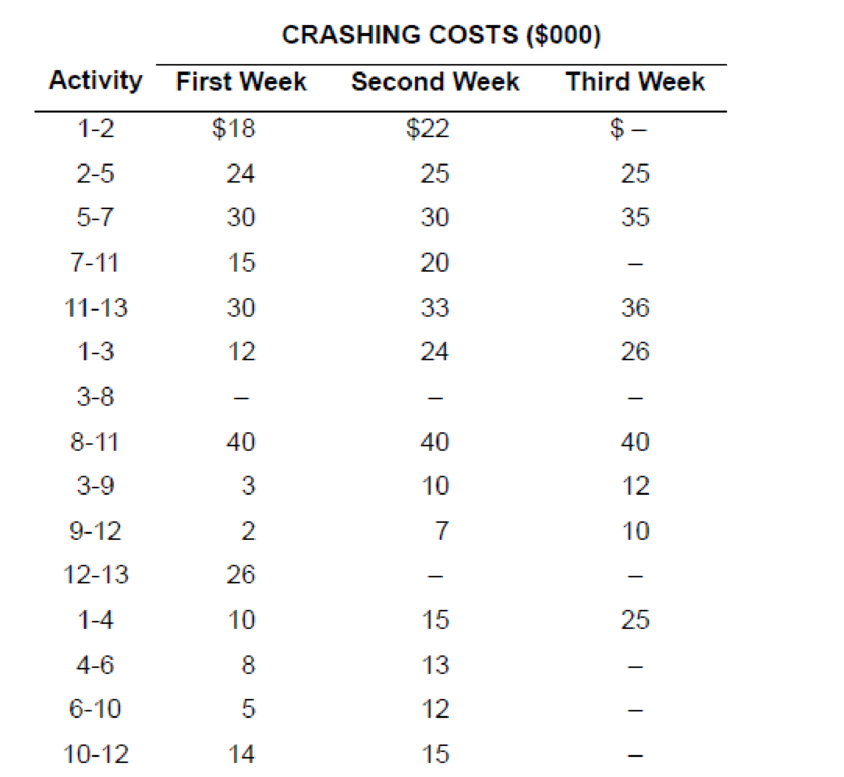
Crashing costs for each activity are:
a. Determine the optimum time–cost crashing plan.
b. Plot the total-cost curve that describes the least expensive crashing
a)
To determine: The optimum cost-saving plan.
Introduction:
Project crashing:
It is method to shorten the total time taken for a project by reducing the time taken for one or more activities on the critical path. The reduction in the normal time taken is known as crashing.
Answer to Problem 15P
Explanation of Solution
Given information:
- Indirect cost is $40,000 per week.
| Activity | Crash cost first week ($000) | Crash cost second week ($000) | Crash cost third week ($000) |
| 1 to 2 | 18 | 22 | |
| 2 to 5 | 24 | 25 | 25 |
| 5 to 7 | 30 | 30 | 35 |
| 7 to 11 | 15 | 20 | |
| 11 to 13 | 30 | 33 | 36 |
| 1 to 3 | 12 | 24 | 26 |
| 3 to 8 | |||
| 8 to 11 | 40 | 40 | 40 |
| 3 to 9 | 3 | 10 | 12 |
| 9 to 12 | 2 | 7 | 10 |
| 12 to 13 | 26 | ||
| 1 to 4 | 10 | 15 | 25 |
| 4 to 6 | 8 | 13 | |
| 6 to 10 | 5 | 12 | |
| 10 to 12 | 14 | 15 |
Project crashing:
Calculation of expected duration of each path:
Path 1-2-5-7-11-13:
Path 1-3-8-11-13:
Path 1-3-9-12-13:
Path 1-4-6-10-12-13:
Step 1:
Critical path is 1-2-5-7-11-13.
The activities are ranked according to the cost per week to crash.
| Activity | Cost ($) |
| 7-11 | 15 |
| 1-2 | 18 |
| 2-5 | 24 |
| 5-7 | 30 |
| 11-13 | 30 |
Activity 7-11 will be crashed first by 1 week since it has the lowest crashing cost ($15) and this cost is ≤ 40. Path 1-2-5-7-11-13 will decrease by 1 week.
Step 2:
The paths and new expected duration are:
| Path | Expected Duration |
| 1-2-5-7-11-13 | 34 |
| 1-3-8-11-13 | 32 |
| 1-3-9-12-13 | 20 |
| 1-4-6-10-12-13 | 33 |
Critical path is 1-2-5-7-11-13.
The activities are ranked according to the cost per week to crash.
| Activity | Cost ($) |
| 1-2 | $18 |
| 7-11 | $20 |
| 2-5 | $24 |
| 5-7 | $30 |
| 11-13 | $30 |
Activity 1-2 will be crashed first by 1 week since it has the lowest crashing cost ($18) and this cost is ≤ 40. Path 1-2-5-7-11-13 will decrease by 1 week.
Step 3:
The paths and new expected duration are:
| Path | Expected Duration |
| 1-2-5-7-11-13 | 33 |
| 1-3-8-11-13 | 32 |
| 1-3-9-12-13 | 20 |
| 1-4-6-10-12-13 | 33 |
Critical path is 1-2-5-7-11-13 and 1-4-6-10-12-13.
The activities are ranked according to the cost per week to crash.
| Path | Activity | Cost ($) |
| 1-2-5-7-11-13 | 7-11 | $20 |
| 1-2 | $22 | |
| 2-5 | $24 | |
| 5-7 | $30 | |
| 11-13 | $30 | |
| 1-4-6-10-12-13 | 6-10 | $5 |
| 4-6 | $8 | |
| 1-4 | $10 | |
| 10-12 | $14 | |
| 12-13 | $26 |
Activity 7-11 will be crashed first by 1 week since it has the lowest crashing cost ($20). Path 1-2-5-7-11-13 will decrease by 1 week.
Activity 6-10 will be crashed first by 1 week since it has the lowest crashing cost ($5). Path 1-4-6-10-12-13 will decrease by 1 week.
The combined crash cost ($25) is ≤ $40.
Step 4:
The paths and new expected duration are:
| Path | Expected Duration |
| 1-2-5-7-11-13 | 32 |
| 1-3-8-11-13 | 32 |
| 1-3-9-12-13 | 20 |
| 1-4-6-10-12-13 | 32 |
Critical path is 1-2-5-7-11-13, 1-3-8-11-13, and 1-4-6-10-12-13.
The activities are ranked according to the cost per week to crash.
| Path | Activity | Cost ($) |
| 1-2-5-7-11-13 | 1-2 | $22 |
| 2-5 | $24 | |
| 5-7 | $30 | |
| 11-13 | $30 | |
| 1-3-8-11-13 | 1-3 | $12 |
| 11-13 | $30 | |
| 8-11 | $40 | |
| 1-4-6-10-12-13 | 4-6 | $8 |
| 1-4 | $10 | |
| 6-10 | $12 | |
| 10-12 | $14 | |
| 12-13 | $26 |
Activity 11-13 will be crashed first by 1 week since it has the lowest crashing cost ($30). Paths 1-2-5-7-11-13 and 1-3-8-11-13 will decrease by 1 week.
Activity 4-6 will be crashed first by 1 week since it has the lowest crashing cost ($8). Path 1-4-6-10-12-13 will decrease by 1 week.
The combined crash cost ($38) is ≤ $40.
Step 5:
The paths and new expected duration are:
| Path | Expected Duration |
| 1-2-5-7-11-13 | 31 |
| 1-3-8-11-13 | 31 |
| 1-3-9-12-13 | 20 |
| 1-4-6-10-12-13 | 31 |
Critical path is 1-2-5-7-11-13, 1-3-8-11-13, and 1-4-6-10-12-13.
The activities are ranked according to the cost per week to crash.
| Path | Activity | Cost ($) |
| 1-2-5-7-11-13 | 1-2 | $22 |
| 2-5 | $24 | |
| 5-7 | $30 | |
| 11-13 | $33 | |
| 1-3-8-11-13 | 1-3 | $12 |
| 11-13 | $33 | |
| 8-11 | $40 | |
| 1-4-6-10-12-13 | 1-4 | $10 |
| 6-10 | $12 | |
| 4-6 | $13 | |
| 10-12 | $14 | |
| 12-13 | $26 |
Activity 11-13 could be crashed first by 1 week since it has the lowest crashing cost ($33). Paths 1-2-5-7-11-13 and 1-3-8-11-13 will decrease by 1 week.
Activity 1-4 could be crashed first by 1 week since it has the lowest crashing cost ($10). Path 1-4-6-10-12-13 will decrease by 1 week.
The combined crash cost ($43) is ≥ $40.
Since the marginal cost of crashing is greater than the marginal benefit of crashing, crashing will be stopped at step 4.
The final project duration time is 31 weeks. The activities that are crashed are:
Activity 7-11 (First week)
Activity 7-11 (Second week)
Activity 1-2
Activity 6-10
Activity 11-13
Activity 4-6
Calculation of total crashing cost:
The total crashing cost is calculated by summing the crashing cost involved all the steps and the indirect costs every week.
The activities to be crashed are: 7-11, 1-2, 6-10, 11-13, and 4-6. The total crashing cost is $1,336,000.
b)
To Plot: The cost curve with the least expensive crashing which will reduce the project by 6 weeks.
Introduction:
Project crashing:
It is method to shorten the total time taken for a project by reducing the time taken for one or more activities on the critical path. The reduction in the normal time taken is known as crashing.
Answer to Problem 15P
Cost curve:
Explanation of Solution
Given information:
- Indirect cost is $40,000 per week.

| Activity | Crash cost first week ($000) | Crash cost second week ($000) | Crash cost third week ($000) |
| 1 to 2 | 18 | 22 | |
| 2 to 5 | 24 | 25 | 25 |
| 5 to 7 | 30 | 30 | 35 |
| 7 to 11 | 15 | 20 | |
| 11 to 13 | 30 | 33 | 36 |
| 1 to 3 | 12 | 24 | 26 |
| 3 to 8 | |||
| 8 to 11 | 40 | 40 | 40 |
| 3 to 9 | 3 | 10 | 12 |
| 9 to 12 | 2 | 7 | 10 |
| 12 to 13 | 26 | ||
| 1 to 4 | 10 | 15 | 25 |
| 4 to 6 | 8 | 13 | |
| 6 to 10 | 5 | 12 | |
| 10 to 12 | 14 | 15 |
Project crashing:
Calculation of expected duration of each path:
Path 1-2-5-7-11-13:
Path 1-3-8-11-13:
Path 1-3-9-12-13:
Path 1-4-6-10-12-13:
Step 1:
Critical path is 1-2-5-7-11-13.
The activities are ranked according to the cost per week to crash.
| Activity | Cost ($) |
| 7-11 | 15 |
| 1-2 | 18 |
| 2-5 | 24 |
| 5-7 | 30 |
| 11-13 | 30 |
Activity 7-11 will be crashed first by 1 week since it has the lowest crashing cost ($15) and this cost is ≤ 40. Path 1-2-5-7-11-13 will decrease by 1 week.
Step 2:
The paths and new expected duration are:
| Path | Expected Duration |
| 1-2-5-7-11-13 | 34 |
| 1-3-8-11-13 | 32 |
| 1-3-9-12-13 | 20 |
| 1-4-6-10-12-13 | 33 |
Critical path is 1-2-5-7-11-13.
The activities are ranked according to the cost per week to crash.
| Activity | Cost ($) |
| 1-2 | $18 |
| 7-11 | $20 |
| 2-5 | $24 |
| 5-7 | $30 |
| 11-13 | $30 |
Activity 1-2 will be crashed first by 1 week since it has the lowest crashing cost ($18) and this cost is ≤ 40. Path 1-2-5-7-11-13 will decrease by 1 week.
Step 3:
The paths and new expected duration are:
| Path | Expected Duration |
| 1-2-5-7-11-13 | 33 |
| 1-3-8-11-13 | 32 |
| 1-3-9-12-13 | 20 |
| 1-4-6-10-12-13 | 33 |
Critical path is 1-2-5-7-11-13 and 1-4-6-10-12-13.
The activities are ranked according to the cost per week to crash.
| Path | Activity | Cost ($) |
| 1-2-5-7-11-13 | 7-11 | $20 |
| 1-2 | $22 | |
| 2-5 | $24 | |
| 5-7 | $30 | |
| 11-13 | $30 | |
| 1-4-6-10-12-13 | 6-10 | $5 |
| 4-6 | $8 | |
| 1-4 | $10 | |
| 10-12 | $14 | |
| 12-13 | $26 |
Activity 7-11 will be crashed first by 1 week since it has the lowest crashing cost ($20). Path 1-2-5-7-11-13 will decrease by 1 week.
Activity 6-10 will be crashed first by 1 week since it has the lowest crashing cost ($5). Path 1-4-6-10-12-13 will decrease by 1 week.
The combined crash cost ($25) is ≤ $40.
Step 4:
The paths and new expected duration are:
| Path | Expected Duration |
| 1-2-5-7-11-13 | 32 |
| 1-3-8-11-13 | 32 |
| 1-3-9-12-13 | 20 |
| 1-4-6-10-12-13 | 32 |
Critical path is 1-2-5-7-11-13, 1-3-8-11-13, and 1-4-6-10-12-13.
The activities are ranked according to the cost per week to crash.
| Path | Activity | Cost ($) |
| 1-2-5-7-11-13 | 1-2 | $22 |
| 2-5 | $24 | |
| 5-7 | $30 | |
| 11-13 | $30 | |
| 1-3-8-11-13 | 1-3 | $12 |
| 11-13 | $30 | |
| 8-11 | $40 | |
| 1-4-6-10-12-13 | 4-6 | $8 |
| 1-4 | $10 | |
| 6-10 | $12 | |
| 10-12 | $14 | |
| 12-13 | $26 |
Activity 11-13 will be crashed first by 1 week since it has the lowest crashing cost ($30). Paths 1-2-5-7-11-13 and 1-3-8-11-13 will decrease by 1 week.
Activity 4-6 will be crashed first by 1 week since it has the lowest crashing cost ($8). Path 1-4-6-10-12-13 will decrease by 1 week.
The combined crash cost ($38) is ≤ $40.
Step 5:
The paths and new expected duration are:
| Path | Expected Duration |
| 1-2-5-7-11-13 | 31 |
| 1-3-8-11-13 | 31 |
| 1-3-9-12-13 | 20 |
| 1-4-6-10-12-13 | 31 |
Critical path is 1-2-5-7-11-13, 1-3-8-11-13, and 1-4-6-10-12-13.
The activities are ranked according to the cost per week to crash.
| Path | Activity | Cost ($) |
| 1-2-5-7-11-13 | 1-2 | $22 |
| 2-5 | $24 | |
| 5-7 | $30 | |
| 11-13 | $33 | |
| 1-3-8-11-13 | 1-3 | $12 |
| 11-13 | $33 | |
| 8-11 | $40 | |
| 1-4-6-10-12-13 | 1-4 | $10 |
| 6-10 | $12 | |
| 4-6 | $13 | |
| 10-12 | $14 | |
| 12-13 | $26 |
Activity 11-13 will be crashed first by 1 week since it has the lowest crashing cost ($33). Paths 1-2-5-7-11-13 and 1-3-8-11-13 will decrease by 1 week.
Activity 1-4 will be crashed first by 1 week since it has the lowest crashing cost ($10). Path 1-4-6-10-12-13 will decrease by 1 week. The combined crash cost is ($43).
Step 6:
The paths and new expected duration are:
| Path | Expected Duration |
| 1-2-5-7-11-13 | 30 |
| 1-3-8-11-13 | 30 |
| 1-3-9-12-13 | 20 |
| 1-4-6-10-12-13 | 30 |
Critical path is 1-2-5-7-11-13, 1-3-8-11-13, and 1-4-6-10-12-13.
The activities are ranked according to the cost per week to crash.
| Path | Activity | Cost ($) |
| 1-2-5-7-11-13 | 1-2 | $22 |
| 2-5 | $24 | |
| 5-7 | $30 | |
| 11-13 | $36 | |
| 1-3-8-11-13 | 1-3 | $12 |
| 11-13 | $36 | |
| 8-11 | $40 | |
| 1-4-6-10-12-13 | 6-10 | $12 |
| 4-6 | $13 | |
| 10-12 | $14 | |
| 1-4 | $15 | |
| 12-13 | $26 |
Activity 1-2 will be crashed first by 1 week since it has the lowest crashing cost ($22). Path 1-2-5-7-11-13 will decrease by 1 week.
Activity 1-3 will be crashed first by 1 week since it has the lowest crashing cost ($12). Path 1-3-8-11-13 will decrease by 1 week.
Activity 6-10 will be crashed first by 1 week since it has the lowest crashing cost ($12). Path 1-4-6-10-12-13 will decrease by 1 week. The combined crash cost is ($436.
The final project duration time is 29 weeks. The activities that are crashed are:
Activity 7-11 (First week)
Activity 7-11 (Second week)
Activity 1-2 (First week)
Activity 1-2 (Second week)
Activity 11-13 (First week)
Activity 11-13 (Second week)
Activity 4-6
Activity 6-10
Activity 1-4
Activity 1-3
Calculation of total crashing cost:
The total crashing cost is calculated by summing the crashing cost involved all the steps and the indirect costs every week.
Summarization of total costs for different project lengths:
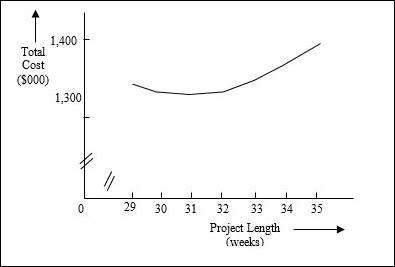
| Project Length | Cumulative Weeks shortened | Cumulative crash cost ($000) | Indirect cost ($000) | Total cost ($000) |
| A | B | C |
|
E = C+D |
| 35 | 0 | $ - | $ 1,400.00 | $ 1,400.00 |
| 34 | 1 | $ 15.00 | $ 1,360.00 | $ 1,375.00 |
| 33 | 2 | $ 33.00 | $ 1,320.00 | $ 1,353.00 |
| 32 | 3 | $ 58.00 | $ 1,280.00 | $ 1,338.00 |
| 31 | 4 | $ 96.00 | $ 1,240.00 | $ 1,336.00 |
| 30 | 5 | $ 139.00 | $ 1,200.00 | $ 1,339.00 |
| 29 | 6 | $ 185.00 | $ 1,160.00 | $ 1,345.00 |
Cost curve:
The cost curve is plotted by taking the project length on the X-axis and the total cost on the Y-axis.
Want to see more full solutions like this?
Chapter 17 Solutions
Operations Management (McGraw-Hill Series in Operations and Decision Sciences)


- Humber Web Design Co. is organizing a new project to increase efficiency and improve relations with their clients. The project manager for this initiative has broken the project up into several parts as follows: Activity Activity Description Immediate Predecessor Activity time (days) A Identify Client Base ― 33 B Develop Client Prospectus ― 21 C Perform Design Analysis ― 35 D Program Back End A, B, C 47 E Program Front End A 13 F Project Consolidation D, E 11 (a) For the given project, fill in the nodes of the network diagram below. A E 33 13 Start B D F Finish Time 21 47 11 Time C 35 (b) Using the network diagram, fill in the table. Make sure that you put the values in the appropriate columns. Activity Earliest Start (ES) Latest…arrow_forwardA student club plans on holding a campus-wide event at the end of the semester. The activities that have to be completed, duration of each activity, and their sequence are listed in the table below: Duration Immediate Activity (weeks) Predecessor A 2 -- B 3 A C 1 A D 3 B E 4 D,C F 1 E b. What is the earliest start, earliest finish time, latest start, latest finish time for activity E? Earliest start time _______ Earliest finish time _______ Latest start time _________ Latest finish time ________ C What is the slack for Activity C? Slack for activity C ________arrow_forwardA solved PERT problem is detailed in the table below. The expected time and variance values and the critical activities are given in the table below. Answer the following questions by filling the blanks (WRITE YOUR ANSWERS TO 2 DECIMAL PLACES. DO NOT ROUND UP OR DOWN): a. The expected project completion time for this problem is and the standard deviation is . b. There is a 0.95 probability that the project will be completed by weeks. Activity Expected time Variance Critical? A 10 0.36 Yes B 7 0.11 No C 7 0.25 No D 3 0.48 Yes E 5 1.60 Yes F 7 0.69 No G 2 3.69 Yesarrow_forward
- The project described in the following table has just begun. It is scheduled to be completed in 11 weeks.Use Table B1 and Table B2. Activity Estimated Time(weeks) Standard Deviation(wks.) 1-2 4 0.70 2-4 6 0.90 1-3 3 0.62 3-4 9 1.90 a. If you were the manager of this project, would you be concerned? (Round your intermediate calculations to 2 decimal places and "Probability" values to 4 decimal places.) because the probability of finishing on schedule is only about . b. If there is a penalty of $5,000 a week for each week the project is late, what is the probability of incurring a penalty of at least $5,000? (Round your intermediate calculations to 2 decimal places and "Probability" values to 4 decimal places.) Probability Have worked this with various formulas and all come back wrong. Where am I making a mistakearrow_forwardDue to population growth in the area, the new Liberty High School has just opened in a local school district. The athletic director at Liberty High is planning the launch of the school's track and field team. The first team practice is scheduled for April 1. The activities, their immediate predecessors, and the activity time estimates (in weeks) are listed in the following table. Time (Weeks) Activity Description ImmediatePredecessor Optimistic Most Probable Pessimistic A Meet with board 1 1 2 B Hire coaches A 4 6 8 C Conduct fundraiser A 2 4 6 D Announce program B, C 1 2 3 E Meet with coaches B 2 3 4 F Order team equipment A 1 2 3 G Register athletes D 1 2 3 H Reserve buses for meets G 1 2 3 I Plan first practice E, H, F 1 1 1 (a) Draw a project network. (b) Develop an activity schedule. (Round your answers to two decimal places.) (c) What are the critical activities? (Enter your answers as a comma-separated list.) What is the expected project…arrow_forwardDue to population growth in the area, the new Liberty High School has just opened in a local school district. The athletic director at Liberty High is planning the launch of the school's track and field team. The first team practice is scheduled for April 1. The activities, their immediate predecessors, and the activity time estimates (in weeks) are listed in the following table. Time (Weeks) Activity Description ImmediatePredecessor Optimistic Most Probable Pessimistic A Meet with board 1 1 2 B Hire coaches A 4 6 8 C Conduct fundraiser A 2 4 6 D Announce program B, C 1 2 3 E Meet with coaches B 2 3 4 F Order team equipment A 1 2 3 G Register athletes D 1 2 3 H Reserve buses for meets G 1 2 3 I Plan first practice E, H, F 1 1 1 (a) Draw a project network. A project network with 11 activities and 13 directed arcs is shown. Activity Start is connected to activity A. Activity A is connected to activity B, to activity C, and to activity F. Activity B…arrow_forward
- Due to population growth in the area, the new Liberty High School has just opened in a local school district. The athletic director at Liberty High is planning the launch of the school's track and field team. The first team practice is scheduled for April 1. The activities, their immediate predecessors, and the activity time estimates (in weeks) are listed in the following table. Time (Weeks) Activity Description ImmediatePredecessor Optimistic Most Probable Pessimistic A Meet with board 1 1 2 B Hire coaches A 4 6 8 C Conduct fundraiser A 2 4 6 D Announce program B, C 1 2 3 E Meet with coaches B 2 3 4 F Order team equipment A 1 2 3 G Register athletes D 1 2 3 H Reserve buses for meets G 1 2 3 I Plan first practice E, H, F 1 1 1 (a) Draw a project network. (b) Develop an activity schedule. (Round your answers to two decimal places.) (c) What are the critical activities? (Enter your answers as a comma-separated list.) What is the expected project…arrow_forwardConsider a construction project with the following data on precedence relationships, durations, and costs: Activity Immediate predeccessor (s) Normal Time (days) Normal Cost ($) Crash Time (Days) Crash Cost ($) A - 6 120 4 170 B - 4 120 2 220 C A 3 195 2 270 D A 4 320 2 520 E B, C 7 700 4 1075 F D, E 5 650 2 1100 G E 10 1600 6 2300 F and G are the terminal activities of the project. (a) Find the critical path. (b) Find the project completion time and the corresponding cost. (c) Suppose it is required to complete the project in 22 days. Find which activities to crash and by how much, to yield the minimum project cost. Note:- Do not provide handwritten solution. Maintain accuracy and quality in your answer. Take care of plagiarism. Answer completely. You will get up vote for sure.arrow_forwardPlease, I need help because I have no idea how to do any of these. 11. Building a backyard swimming pool consists of nine major activities. The activities and their immediate predecessors are shown. Develop the project network. For question number 12, you need to refer to question number 11. Also the first picture is for #11 and second picture(image) is for #12 12. Assume that the activity time estimates (in days) for the swimming pool construction project in Problem 11 are as follows: a. What are the critical activities? b. What is the expected time to complete the project? c. Based only on the critical path, what is the estimated probability that the project can be completed in 25 or fewer days?arrow_forward
- The Advanced Tech Company has a project to design anintegrated information database for a major bank. Datafor the project are given in Table 7.6. Indirect project costsamount to $300 per day. The company will incur a $150 perday penalty for each day the project lasts beyond day 14.a. What is the project’s duration if only normal times are used?b. What is the minimum-cost schedule?c. What is the critical path for the minimum-cost schedule?arrow_forwardA project has the activity duration and cost information indicated in the table where all times are in weeks. What is the total cost for completing this project in 50 days? Activity Predecessor Normal Time Normal Cost Crash Time Crash Cost A -- 8 $12,000 5 $21,000 B A 12 $20,000 9 $30,000 C A 15 $24,000 10 $60,000 D B 3 $10,000 2 $15,000 E C 9 $17,000 6 $34,000 F E 7 $5,000 6 $6,000 G D 8 $14,000 6 $20,000 H A 12 $22,000 10 $30,000 I H 6 $50,000 5 $55,000 J F, G, I 11 $33,000 9 $50,000arrow_forwardAnn's team is documenting activity attributes for each schedule activity. What attributes should be included? Select one: a. Activity ID, WBS ID, activity name, activity codes, activity description, predecessor and successor activities, logical relationships, and leads g b. WBS code, resource requirements, and constraints c. Activity description, planned value, and estimate at completion d. Assumptions, cost estimates, responsibility assignment, and justificationarrow_forward
 Practical Management ScienceOperations ManagementISBN:9781337406659Author:WINSTON, Wayne L.Publisher:Cengage,
 Operations ManagementOperations ManagementISBN:9781259667473Author:William J StevensonPublisher:McGraw-Hill Education
 Operations and Supply Chain Management (Mcgraw-hi...Operations ManagementISBN:9781259666100Author:F. Robert Jacobs, Richard B ChasePublisher:McGraw-Hill Education
 Purchasing and Supply Chain ManagementOperations ManagementISBN:9781285869681Author:Robert M. Monczka, Robert B. Handfield, Larry C. Giunipero, James L. PattersonPublisher:Cengage Learning
 Production and Operations Analysis, Seventh Editi...Operations ManagementISBN:9781478623069Author:Steven Nahmias, Tava Lennon OlsenPublisher:Waveland Press, Inc.