
Videos
Financial statement analysis
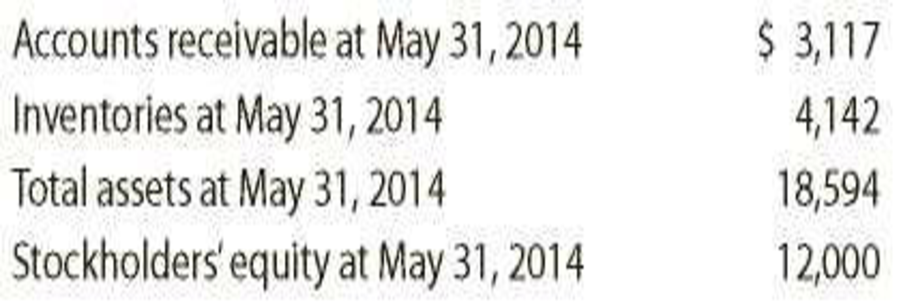
The financial statements for Nike, Inc., are presented in Appendix D at the end of the text. Use the following additional information (in thousands):
Instructions
- 1. Determine the following measures for the fiscal years ended May 31, 2016, and May 31, 2015. Round ratios and percentages to one decimal place.
- a.
Working capital - b.
Current ratio - c. Quick ratio
- d.
Accounts receivable turnover - e. Number of days’ sales in receivables
- f. Inventory turnover
- g. Number of days’ sales in inventory
- h. Ratio of liabilities to stockholders’ equity
- i. Asset turnover
- j. Return on total assets.
- k. Return on common stockholders’ equity
- l. Price-earnings ratio, assuming that the market price was $54.90 per share on May 29, 2016, and $52.81 per share on May 30, 2015
- m. Percentage relationship of net income to sales
- a.
- 2. What conclusions can be drawn from these analyses?
1.
Determine the following ratios for the fiscal years ended May 31, 2016 and May 31, 2015:
- (a) Working capital
- (b) Current ratio
- (c) Quick ratio
- (d) Accounts receivable turnover ratio
- (e) Number of days’ sales in receivables
- (f) Inventory turnover ratio
- (g) Number of days’ sales in inventory
- (h) Ratio of liabilities to stockholders’ equity
- (i) Asset turnover ratio
- (j) Return on total assets
- (k) Return on common stockholders’ equity
- (l) Price-earnings ratio
- (m) Percentage relationship of net income to sales
Explanation of Solution
Financial Ratios: Financial ratios are the metrics used to evaluate the liquidity, capabilities, profitability, and overall performance of a company.
(a)
Working capital is determined as the difference between current assets and current liabilities.
Formula:
Calculate working capital for May 31, 2015 and May 31, 2016.
Thus, working capital for 2016 and 2015 is $9,667.0 and $9,255.0
b)
Current ratio is used to determine the relationship between current assets and current liabilities. The ideal current ratio is 2:1. Current assets include cash and cash equivalents, short-term investments, net, accounts and notes receivables, net, inventories, and prepaid expenses and other current assets. Current liabilities include short-term obligations and accounts payable.
Formula:
Current ratio for 2016 and 2015
Thus, current ratio for 2016 and 2015 is 2.8 and 2.5
c)
Acid-Test Ratio is the ratio denotes that this ratio is a more rigorous test of solvency than the current ratio. It is determined by dividing quick assets and current liabilities. The acceptable acid-test ratio is 0.90 to 1.00. Use the following formula to determine the acid-test ratio:
Acid-test ratio for 2016
Working notes:
Quick Assets are those assets that are most liquid. The examples of quick assets include cash and bank balances, marketable securities, and sundry debtors. Use the following formula to determine the Quick assets:
Hence, quick ratio for 2016 and 2015 are 1.6 and 1.5 respectively.
d)
Accounts receivable turnover ratio for 2016 and 2015
Description:
Accounts receivables turnover ratio is mainly used to evaluate the collection process efficiency. It helps the company to know the number of times the accounts receivable is collected in a particular time period. Main purpose of accounts receivable turnover ratio is to manage the working capital of the company. This ratio is determined by dividing credit sales and sales return.
Formula:
Average accounts receivable, net for 2016 and 2015 is determined as follows:
Hence, the accounts receivable turnover ratio for 2016 and 2015 is 9.8 times and 9.5 times.
e)
Number of days’ sales in receivables for 2016 and 2015
Description:
Number of days’ sales in receivables is used to determine the number of days a particular company takes to collect accounts receivables.
Formula:
Average daily sales are determined by dividing sales by 365 days. Average accounts receivables for 2016 and 2015 are determined in previous requirement. Thus, average daily sales for 2016 and 2015 are determined as follows:
Hence, the number of days’ sales in receivable for 2016 and 2015 are 9.8 days and 9.5 days respectively.
f)
Inventory turnover ratio for 2016 and 2015
Description:
Inventory turnover ratio is used to determine the number of times inventory used or sold during the particular accounting period.
Formula:
Average inventory for 2016 and 2015 is determined as below:
Hence, the inventory turnover ratio for 2016and 2015 is 3.8 and 4.0 respectively.
g)
Number of days sales in inventory for 2016 and 2015
Description:
Number of days’ sales in inventory is determined as the number of days a particular company takes to make sales of the inventory available with them.
Formula:
Average daily cost of goods sold are determined by dividing cost of goods sold by 365 days. Thus, average daily cost of goods sold are determined as follows:
Hence, the number of days’ sales in inventory for 2016 and 2015 are 96.2 days and 91.4 days respectively.
h)
Ratio of liabilities to stockholders’ equity for 2016 and 2015.
Description:
Ratio of liabilities to stockholders’ equity is determined by dividing liabilities and stockholders’ equity.
Formula:
Hence, the ratio of liabilities to stockholders’ equity for 2016 and 2015 is 0.7.
i)
Asset turnover ratio for 2016 and 2015
Description:
Asset turnover ratio is used to determine the asset’s efficiency towards sales.
Formula:
Working notes for average total assets for 2016 and 2015 are as follows:
Hence, asset turnover ratio for 2016 and 2015 is 1.5.
j)
Return on total assets for 2016 and 2015
Description:
Return on assets determines the particular company’s overall earning power. It is determined by dividing sum of net income and interest expense and average total assets.
Formula:
Hence, rate of return on assets for 2016 and 2015 are 17.6% and 16.4% respectively.
k)
Return on common stockholders’ equity for 2016 and 2015
Description:
Rate of return on stockholders’ equity is used to determine the relationship between the net income and the average common equity that are invested in the company.
Formula:
Average stockholders’ equity is determined as follows:
Hence, rate of return on stockholders’ equity for 2016 and 2015 are 30.1% and 26.5% respectively.
l)
Price earnings ratio for 2016 and 2015
Description:
Price/earnings ratio is used to determine the profitability of a company. This ratio is abbreviated as P/E.
Formula:
Hence, the calculated price-earnings ratio for 2016 and 2015 is 24.8 and 28.5 respectively.
m)
Net income to sales for 2016 and 2015
Description:
Net income to sales is determined by dividing net income to sales.
Formula:
Thus, summary table of determined ratios are below:
| Particulars | 2016 | 2015 |
| $9,667.0 | $9,255.0 |
| 2.8 | 2.5 |
| 1.6 | 1.5 |
| 9.8 | 9.5 |
| 37.2 days | 38.6 days |
| 3.8 times | 4.0 times |
| 96.2 days | 91.4 days |
| 0.7 | 0.7 |
| 1.5 | 1.5 |
| 17.6% | 16.4% |
| 30.1% | 26.5% |
| 24.8 times | 28.5 times |
| 11.6% | 10.7% |
2.
Draw conclusion about the analysis made in requirement 1.
Explanation of Solution
- The working capital ratio has increased in the year 2016 when compared with 2015.
- The current ratio and quick ratio of the company have increased during the year 2016.
- The accounts receivable turnover ratio and number of days’ sales in receivables have increased in the year 2016. But, whereas, number of days’ sales receivables have decreased slightly. Thus, here, company takes over one month to collect the accounts receivables from credit sales.
- Inventory turnover ratio and number of days’ sales in inventory is increased and it is critical for the company. Thus, it shows a favorable change.
- Creditor’s protection remained constant and thus, it is very sound from the ratio of liabilities to stockholders’ equity.
- Asset turnover ratio indicates assets were used effectively towards generation of revenues for both the years.
- Return on total assets has increased during the year 2016. Net income has increased.
- Return on common stockholders’ equity has increased and it has strong earnings performance in the year 2016.
- The price-earnings ratio has decreased in the year 2016.
- The percentage of net income to sales has increased during 2016.
Want to see more full solutions like this?
Chapter 17 Solutions
EBK FINANCIAL ACCOUNTING


- Real-world annual report The financial statements for Nike, Inc. (NKE), are presented in Appendix E at the end of the text. The following additional information is available (in thousands): Instructions 1. Determine the following measures for the fiscal years ended May 31, 2017, and May 31, 2016. Round ratios and percentages to one decimal place. a. Working capital b. Current ratio c. Quick ratio d. Accounts receivable turnover e. Number of days sales in receivables f. Inventory turnover g. Number of days sales in inventory' h. Ratio of liabilities to stockholders equity i. Asset turnover j. Return on total assets, assuming interest expense is 82 million for the year ending May 31. 2017, and 33 million for the year ending May 31, 2016. k. k. Return on common stockholders equity l. Price-eamings ratio, assuming that the market price was 52.81 per share on May 31, 2017, and 54.35 per share on May 31, 2016. m. m. Percentage relationship of net income to sales 2. What conclusions can be drawn from these analyses?arrow_forwardFinancial Statement Analysis The financial statements for Nike, Inc., are presented in Appendix C at the end of the text. The following additional information (in thousands) is available: Instructions 1. Determine the following measures for the fiscal years ended May 31, 2013 (fiscal 2012), and May 31, 2012 (fiscal 2011), rounding to one decimal place. a. Working capital b. Current ratio c. Quick ratio d. Accounts receivable turnover e. Number of days sales in receivables f. Inventory turnover g. Number of days sales in inventory h. Ratio of liabilities to stockholders equity i. Ratio of sales to assets j. Rate earned on total assets, assuming interest expense is 23 million for the year ending May 31, 2013, and 31 million for the year ending May 31, 2012 k. Rate earned on common stockholders equity l. Price-earnings ratio, assuming that the market price was 61.66 per share on May 31, 2013, and 53.10 per share on May 31, 2012 m. Percentage relationship of net income to sales 2. What conclusions can be drawn from these analyses?arrow_forwardJuroe Company provided the following income statement for last year: Juroes balance sheet as of December 31 last year showed total liabilities of 10,250,000, total equity of 6,150,000, and total assets of 16,400,000. Required: Note: Round answers to two decimal places. 1. Calculate the times-interest-earned ratio. 2. Calculate the debt ratio. 3. Calculate the debt-to-equity ratio.arrow_forward
- FINANCIAL RATIOS Use the work sheet and financial statements prepared in Problem 15-8B. All sales are credit sales. The Accounts Receivable balance on January 1 was 38,200. REQUIRED Prepare the following financial ratios: (a)Working capital (b)Current ratio (c)Quick ratio (d)Return on owners equity (e)Accounts receivable turnover and the average number of days required to collect receivables (f)Inventory turnover and the average number of days required to sell inventoryarrow_forwardFINANCIAL RATIOS Use the spreadsheet and financial statements prepared in Problem 15-8A. All sales are credit sales. The Accounts Receivable balance on January 1, 20--, was 10,200. REQUIRED Prepare the following financial ratios: (a) Current ratio (b) Quick ratio (c) Working capital (d) Return on owners equity (e) Accounts receivable turnover and average number of days required to collect receivables (f) Inventory turnover and average number of days required to sell inventoryarrow_forwardRatio Analysis The following information was taken from Nash Inc.s trial balances as of December 31, 2018, and December 31, 2019. Required: 1. Calculate the net profit margin and accounts receivable turnover for 2019. ( Note: Round answers to two decimal places.) 2. How much does Nash make on each sales dollar? 3. How many days does the average receivable take to be paid (assuming all sales are on account)?arrow_forward
- FINANCIAL RATIOS Use the work sheet and financial statements prepared in Problem 15-8A. All sales are credit sales. The Accounts Receivable balance on January 1,20--, was 3,800. REQUIRED Prepare the following financial ratios: (a) Working capital (b) Current ratio (c) Quick ratio (d) Return on owners equity (e) Accounts receivable turnover and average number of days required to collect receivables (f) Inventory turnover and average number of days required to sell inventoryarrow_forwardFINANCIAL RATIOS Based on the financial statements for Jackson Enterprises (income statement, statement of owners equity, and balance sheet) shown on pages 596597, prepare the following financial ratios. All sales are credit sales. The Accounts Receivable balance on January 1, 20--, was 21,600. 1. Working capital 2. Current ratio 3. Quick ratio 4. Return on owners equity 5. Accounts receivable turnover and average number of days required to collect receivables 6. Inventory turnover and average number of days required to sell inventoryarrow_forwardFINANCIAL RATIOS Based on the financial statements, shown on pages 603604, for McDonald Carpeting Co. (income statement, statement of owners equity, and balance sheet), prepare the following financial ratios. All sales are credit sales. The balance of Accounts Receivable on January 1, 20--, was 6,800. 1. Working capital 2. Current ratio 3. Quick ratio 4. Return on owners equity 5. Accounts receivable turnover and average number of days required to collect receivables 6. Inventory turnover and average number of days required to sell inventoryarrow_forward
- FINANCIAL RATIOS Based on the financial statements foe Jackson Enterprises (income statement, statement of owners equity, and balance sheet) shown on pages 598599, prepare the following financial ratios. All sales are credit sales. The Accounts Receivable balance on January 1, 20--, was 21,600. 1. Working capital 2. Current ratio 3. Quick ratio 4. Return on owners equity 5. Accounts receivable turnover and average number of days required to collect receivables 6. Inventory turnover and average number of days required to sell inventoryarrow_forwardFINANCIAL RATIOS Based on the financial statements, shown on pages 605606, for McDonald Carpeting Co. (income statement, statement of owners equity, and balance sheet), prepare the following financial ratios. All sales are credit sales. The balance of Accounts Receivable on January 1, 20--, was 6,800. 1. Working capital 2. Current ratio 3. Quick ratio 4. Return on owners equity 5. Accounts receivable turnover and the average number of days required to collect receivables 6. Inventory turnover and the average number of days required to sell inventoryarrow_forwardThe following selected information is taken from the financial statements of Arnn Company for its most recent year of operations: During the year, Arnn had net sales of 2.45 million. The cost of goods sold was 1.3 million. Required: Note: Round all answers to two decimal places. 1. Compute the current ratio. 2. Compute the quick or acid-test ratio. 3. Compute the accounts receivable turnover ratio. 4. Compute the accounts receivable turnover in days. 5. Compute the inventory turnover ratio. 6. Compute the inventory turnover in days.arrow_forward
 Financial AccountingAccountingISBN:9781337272124Author:Carl Warren, James M. Reeve, Jonathan DuchacPublisher:Cengage Learning
 Financial And Managerial AccountingAccountingISBN:9781337902663Author:WARREN, Carl S.Publisher:Cengage Learning,
 Managerial AccountingAccountingISBN:9781337912020Author:Carl Warren, Ph.d. Cma William B. TaylerPublisher:South-Western College Pub
 Financial AccountingAccountingISBN:9781305088436Author:Carl Warren, Jim Reeve, Jonathan DuchacPublisher:Cengage Learning
 Corporate Financial AccountingAccountingISBN:9781305653535Author:Carl Warren, James M. Reeve, Jonathan DuchacPublisher:Cengage Learning
 College Accounting, Chapters 1-27AccountingISBN:9781337794756Author:HEINTZ, James A.Publisher:Cengage Learning,