Videos
Measures of liquidity, solvency, and profitability
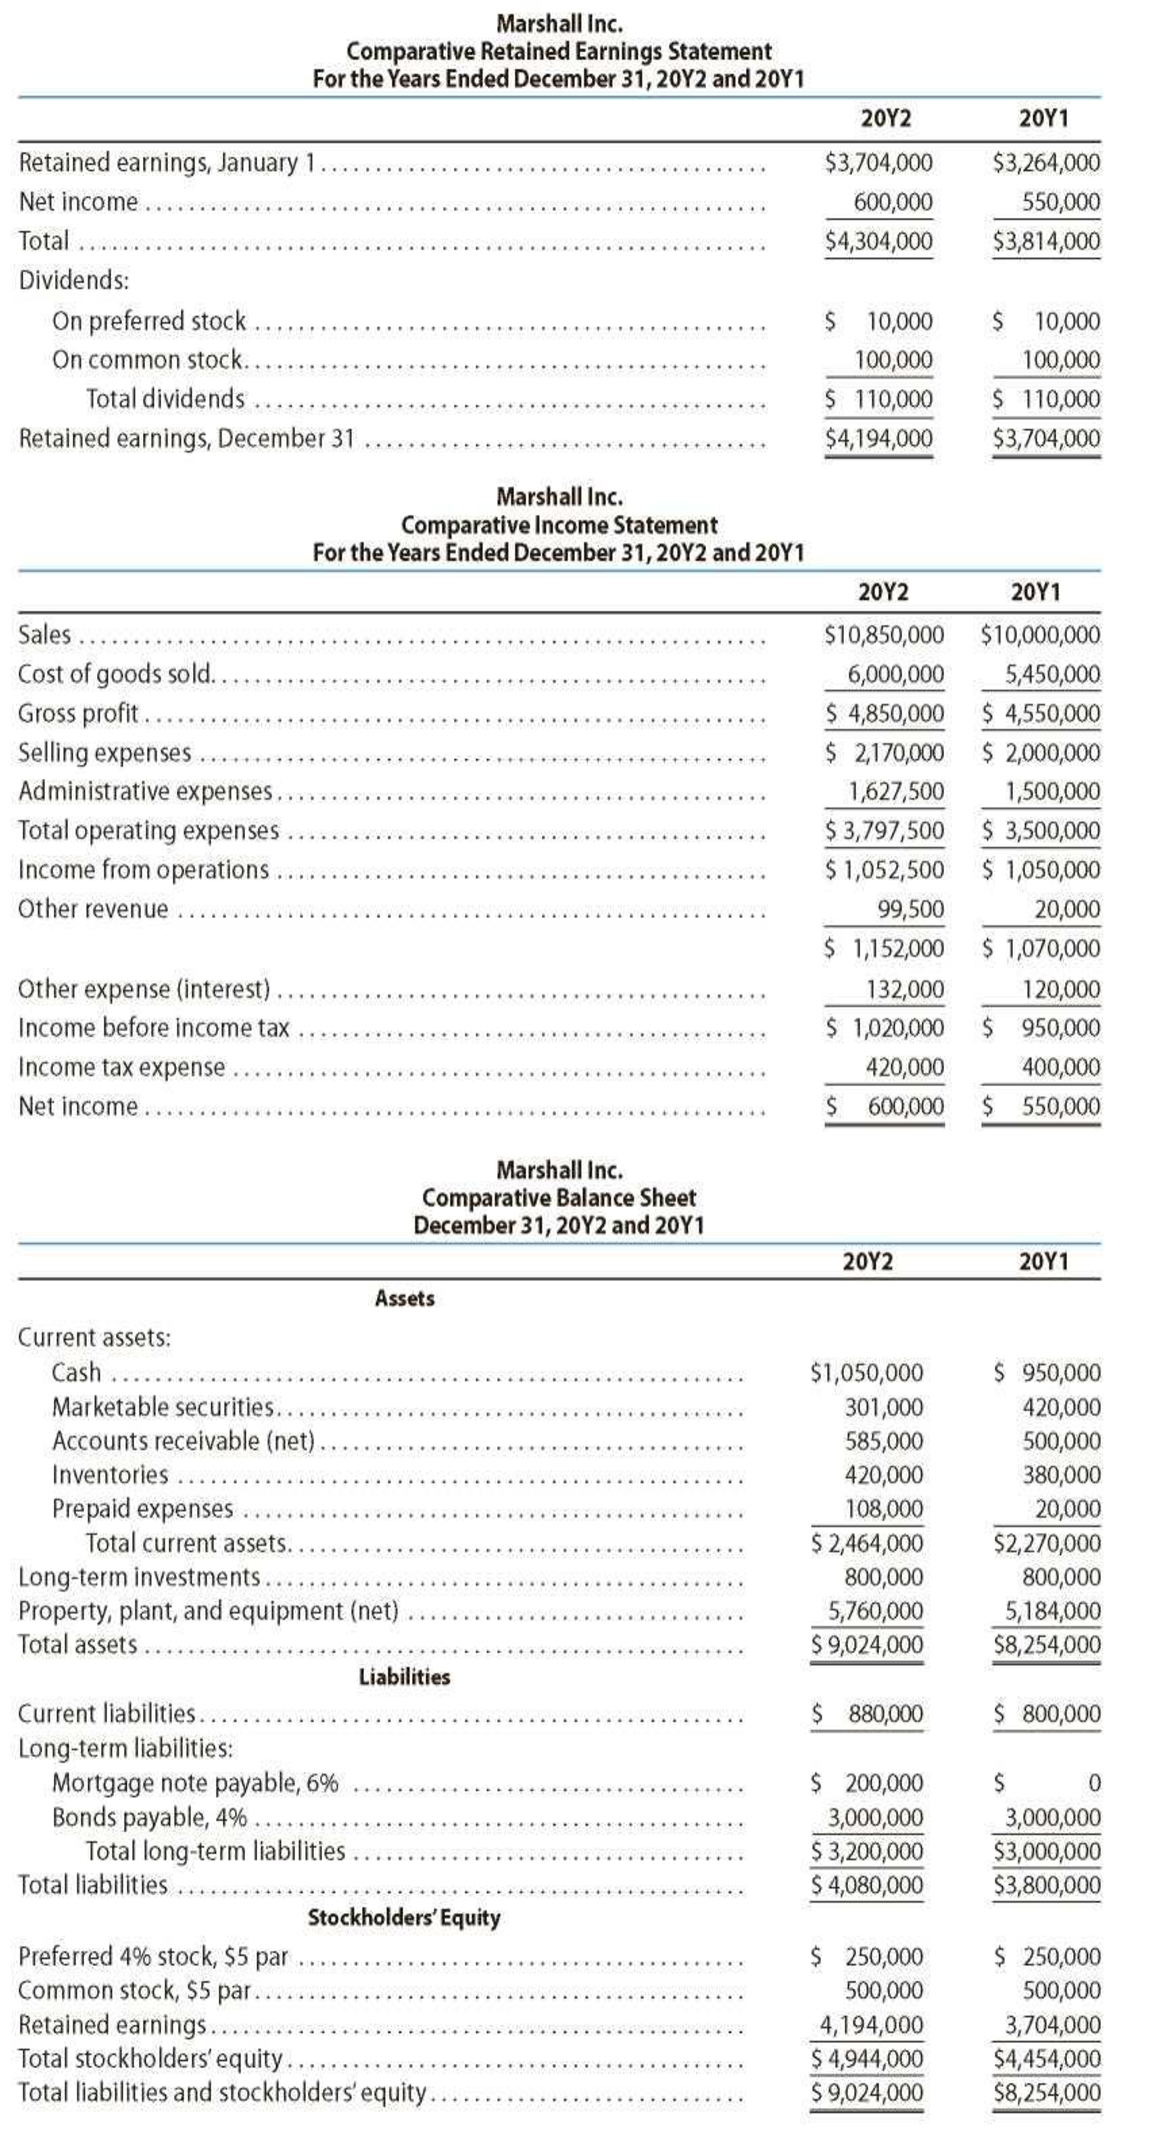
The comparative financial statements of Marshall Inc. are as follows. The market price of Marshall common stock was $82.60 on December 31, 20Y2.
Instructions
Determine the following measures for 20Y2, rounding to one decimal place, including percentages, except for per-share amounts:
- 1.
Working capital - 2.
Current ratio - 3. Quick ratio
- 4.
Accounts receivable turnover - 5. Number of days’ sales in receivables
- 6. Inventory turnover
- 7. Number of days’ sales in inventory
- 8. Ratio of fixed assets to long-term liabilities
- 9. Ratio of liabilities to stockholders’ equity
- 10. Times interest earned
- 11. Asset turnover
- 12. Return on total assets
- 13. Return on stockholders’ equity
- 14. Return on common stockholders’ equity
- 15. Earnings per share on common stock
- 16. Price-earnings ratio
- 17. Dividends per share of common stock
- 18. Dividend yield
Determine the following ratios measures for 20Y2.
- 1. Working capital
- 2. Current ratio
- 3. Quick ratio
- 4. Accounts receivable turnover
- 5. Number of days' sales in receivables
- 6. Inventory turnover ratio
- 7. Number of days' sales in inventory
- 8. Ratio of fixed assets to long-term liabilities
- 9. Ratio of liabilities to stockholders’ equity
- 10. Times interest earned ratio
- 11. Asset turnover ratio
- 12. Return on total assets
- 13. Return on stockholders' equity
- 14. Return on common stockholders' equity
- 15. Earnings per share on common stock
- 16. Price earnings ratio
- 17. Dividends per share of common stock
- 18. Dividend yield
Explanation of Solution
Financial Ratios: Financial ratios are the metrics used to evaluate the capabilities, profitability, and overall performance of a company.
1. Working capital
Description:
Working capital is determined as the difference between current assets and current liabilities.
Formula:
2. Current ratio
Description:
Current ratio is used to determine the relationship between current assets and current liabilities. The ideal current ratio is 2:1. Current assets include cash and cash equivalents, short-term investments, net, accounts and notes receivables, net, inventories, and prepaid expenses and other current assets. Current liabilities include short-term obligations and accounts payable.
Formula:
3. Quick ratio
Description:
Acid-Test Ratio is the ratio denotes that this ratio is a more rigorous test of solvency than the current ratio. It is determined by dividing quick assets and current liabilities. The acceptable acid-test ratio is 0.90 to 1.00. It is referred as quick ratio. Use the following formula to determine the acid-test ratio:
4. Accounts receivable turnover
Description:
Accounts receivables turnover ratio is mainly used to evaluate the collection process efficiency. It helps the company to know the number of times the accounts receivable is collected in a particular time period. Main purpose of accounts receivable turnover ratio is to manage the working capital of the company. This ratio is determined by dividing credit sales and sales return.
Formula:
Average accounts receivable is determined as follows:
5. Number of days’ sales in receivables
Description:
Number of days’ sales in receivables is used to determine the number of days a particular company takes to collect accounts receivables.
Formula:
Average daily sales are determined by dividing sales by 365 days.
6. Inventory turnover ratio
Description:
Inventory turnover ratio is used to determine the number of times inventory used or sold during the particular accounting period.
Formula:
Average inventory is determined as below:
7. Number of days sales in inventory ratio
Description:
Number of days’ sales in inventory is determined as the number of days a particular company takes to make sales of the inventory available with them.
Formula:
Average daily cost of goods sold are determined by dividing cost of goods sold by 365 days. Thus, average daily cost of goods sold are determined as follows:
8. Ratio of fixed assets to long-term liabilities
Description:
Ratio of fixed assets to long-term liabilities is determined by dividing fixed assets and long-term liabilities.
Formula:
9. Ratio of liabilities to stockholders’ equity
Description:
Ratio of liabilities to stockholders’ equity is determined by dividing liabilities and stockholders’ equity.
Formula:
10. Times interest earned ratio
Description:
Times interest earned ratio quantifies the number of times the earnings before interest and taxes can pay the interest expense. First, determine the sum of income before income tax and interest expense. Then, divide the sum by interest expense.
Formula:
11. Asset turnover ratio
Description:
Asset turnover ratio is used to determine the asset’s efficiency towards sales.
Formula:
Working notes for average total assets are as follows:
12. Return on total assets
Description:
Return on assets determines the particular company’s overall earning power. It is determined by dividing sum of net income and interest expense and average total assets.
Formula:
13. Return on stockholders’ equity
Description:
Rate of return on stockholders’ equity is used to determine the relationship between the net income and the average equity that are invested in the company.
Formula:
Average stockholders’ equity is determined as follows:
14. Return on common stockholders’ equity
Description:
Rate of return on stockholders’ equity is used to determine the relationship between the net income and the average common equity that are invested in the company.
Formula:
Average common stockholders’ equity is determined as follows:
15. Earnings per share on common stock
Description:
A portion of profit that an individual earns from each share is referred to earnings per share.
Formula:
16. Price earnings ratio
Description:
Price/earnings ratio is used to determine the profitability of a company. This ratio is abbreviated as P/E.
Formula:
17. Dividend per share of common stock
Description:
Dividend per share of commons stock is determined by dividing dividend per common stock and shares of common stock.
Formula:
18. Dividend yield ratio
Description:
Dividend yield ratio is determined to evaluate the relationship between the annual dividend per share and the market price per share.
Formula:
Thus, summary table of determined ratios are below:
| S.No | Particulars | Ratios |
| 1. | Working capital | $1,584,000 |
| 2. | Current ratio | 2.8 |
| 3. | Acid test ratio | 2.2 |
| 4. | Accounts receivable turnover ratio | 20.0 |
| 5. | Number of days’ sales in receivables | 18.3 |
| 6. | Inventory turnover ratio | 15.0 |
| 7. | Number of days sales in inventory | 24.3 |
| 8. | Ratio of fixed assets to long-term liabilities | 1.8 |
| 9. | Ratio of liabilities to stockholders’ equity | 0.8 |
| 10. | Times interest earned ratio | 8.7 |
| 11. | Asset turnover ratio | 1.3 |
| 12. | Return on total assets | 8.5% |
| 13. | Return on stockholders’ equity | 12.8% |
| 14. | Return on common stockholders’ equity | 13.3% |
| 15. | Earnings per share | $5.90 |
| 16. | Price earnings ratio | 14.0 |
| 17. | Dividend per share of common stock | $1.00 |
| 18. | Dividend yield | 1.2% |
Want to see more full solutions like this?
Chapter 17 Solutions
FINANCIAL ACCOUNTING


- Rebert Inc. showed the following balances for last year: Reberts net income for last year was 3,182,000. Refer to the information for Rebert Inc. above. Also, assume that the dividends paid to common stockholders for last year were 2,600,000 and that the market price per share of common stock is 51.50. Required: 1. Compute the dividends per share. 2. Compute the dividend yield. (Note: Round to two decimal places.) 3. Compute the dividend payout ratio. (Note: Round to two decimal places.)arrow_forwardJuroe Company provided the following income statement for last year: Juroes balance sheet as of December 31 last year showed total liabilities of 10,250,000, total equity of 6,150,000, and total assets of 16,400,000. Required: 1. Calculate the return on sales. (Note: Round the percent to two decimal places.) 2. CONCEPTUAL CONNECTION Briefly explain the meaning of the return on sales ratio, and comment on whether Juroes return on sales ratio appears appropriate.arrow_forwardFive measures of solvency or profitability The balance sheet for Garcon Inc. at the end of the current fiscal year indicated the following: Income before income tax was 3,000,000, and income taxes were 1,200,000 for the current year. Cash dividends paid on common stock during the current year totaled 1,200,000. The common stock was selling for 32 per share at the end of the year. Determine each of the following: (a) times interest earned ratio, (b) earnings per share on common stock, (c) price-earnings ratio, (d) dividends per share of common stock, and (e) dividend yield. Round ratios and percentages to one decimal place, except for per-share amounts.arrow_forward
- ANALY SIS OF PROFITABILITY Based on the financial statement data in Exercise 24-1A, compute the following profitability measures for 20-2 (round all calculations to two decimal places): (a) Profit margin ratio (b) Return on assets (c) Return on common stockholders equity (d) Earnings per share of common stockarrow_forwardStockholder Profitability Ratios The following information pertains to Montague Corporation Required: Calculate the return on common equity and the earnings per share. (Note: Round answers to two decimal places.)arrow_forwardRebert Inc. showed the following balances for last year: Reberts net income for last year was 3,182,000. Refer to the information for Rebert Inc. above. Required: 1. Calculate the average common stockholders equity. 2. Calculate the return on stockholders equity.arrow_forward
- Juroe Company provided the following income statement for last year: Juroes balance sheet as of December 31 last year showed total liabilities of 10,250,000, total equity of 6,150,000, and total assets of 16,400,000. Required: Note: Round answers to two decimal places. 1. Calculate the times-interest-earned ratio. 2. Calculate the debt ratio. 3. Calculate the debt-to-equity ratio.arrow_forwardThe following selected information is taken from the financial statements of Arnn Company for its most recent year of operations: During the year, Arnn had net sales of 2.45 million. The cost of goods sold was 1.3 million. Required: Note: Round all answers to two decimal places. 1. Compute the current ratio. 2. Compute the quick or acid-test ratio. 3. Compute the accounts receivable turnover ratio. 4. Compute the accounts receivable turnover in days. 5. Compute the inventory turnover ratio. 6. Compute the inventory turnover in days.arrow_forwardRatio of liabilities to stockholders equity and times interest earned The following data were taken from the financial statements of Hunter Inc. for December 31 of two recent years: The income before income tax expense was 480,000 and 420,000 for the current and previous years, respectively. A. Determine the ratio of liabilities to stockholders equity at the end of each year. Round to one decimal place. B. Determine the times interest earned ratio for both years. Round to one decimal place. C. What conclusions can be drawn from these data as to the companys ability to meet its currently maturing debts?arrow_forward
 Financial AccountingAccountingISBN:9781337272124Author:Carl Warren, James M. Reeve, Jonathan DuchacPublisher:Cengage Learning
 Managerial AccountingAccountingISBN:9781337912020Author:Carl Warren, Ph.d. Cma William B. TaylerPublisher:South-Western College Pub
 Financial And Managerial AccountingAccountingISBN:9781337902663Author:WARREN, Carl S.Publisher:Cengage Learning,
 College Accounting, Chapters 1-27AccountingISBN:9781337794756Author:HEINTZ, James A.Publisher:Cengage Learning,
 Managerial Accounting: The Cornerstone of Busines...AccountingISBN:9781337115773Author:Maryanne M. Mowen, Don R. Hansen, Dan L. HeitgerPublisher:Cengage Learning
 Cornerstones of Financial AccountingAccountingISBN:9781337690881Author:Jay Rich, Jeff JonesPublisher:Cengage Learning