
Concept explainers
Videos
Quarterly revenue ($ millions) for Twitter for the first quarter of 2012 through the first quarter of 2014 are shown below (adexchange.com, April 2015):
- a. Construct a time series plot. What type of pattern exists in the data?
- b. Using Excel or Minitab, develop a linear trend equation for this time series.
- c. Using Excel or Minitab, develop a
quadratic trend equation for this time series. - d. Compare the MSE for each model. Which model appears better according to MSE?
- e. Use the models developed in parts (b) and (c) to forecast revenue for the tenth quarter.
- f. Which of the two forecasts in part (e) would you use? Explain.
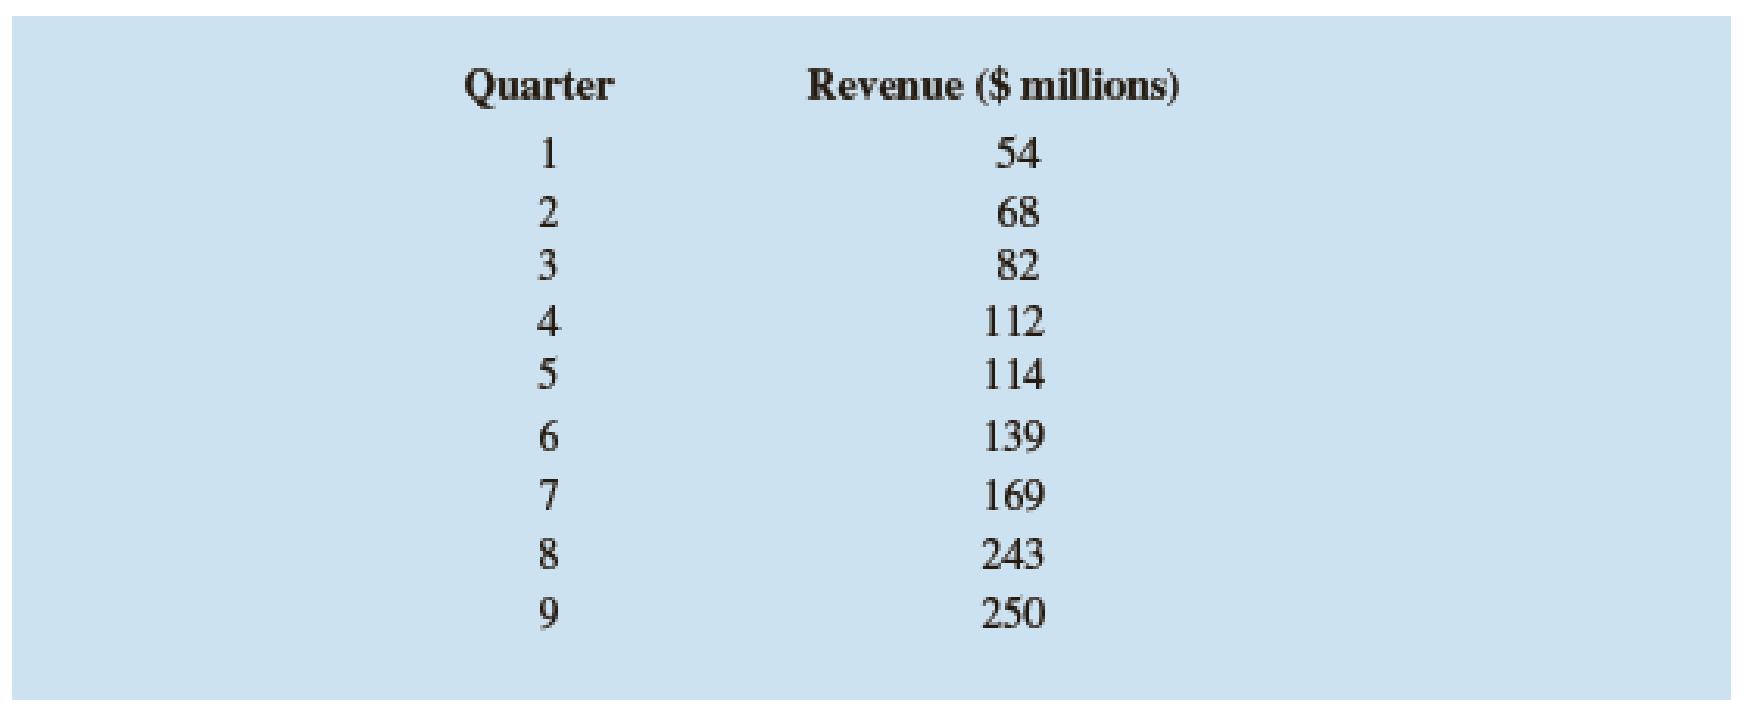
a.
Construct the time series plot.
Explain the type of pattern.
Answer to Problem 25E
The time series plot is given below:
The pattern that appears in the graph is the upward trend.
Explanation of Solution
Calculation:
The given data shows the quarterly revenue for the first quarter of 2012 to the first quarter of 2014.
Software procedure:
Step-by-step software procedure to draw the time series plot using EXCEL:
- Open an EXCEL file.
- In column A, enter the data of Quarter, and in column B, enter the corresponding values of Revenue.
- Select the data that are to be displayed.
- Click on the Insert Tab > select Scatter icon.
- Choose a Scatter with Straight Lines and Markers.
- Click on the chart > select Layout from the Chart Tools.
- Select Chart Title > Above Chart and enter Time Series Plot.
- Select Axis Title > Primary Horizontal Axis Title > Title Below Axis.
- Enter Quarter in the dialog box.
- Select Axis Title > Primary Vertical Axis Title > Rotated Title.
- Enter Revenue in the dialog box.
From the output, the line of graph represents the increase of revenue from year to year.
Thus, the pattern of the graph represents the upward trend.
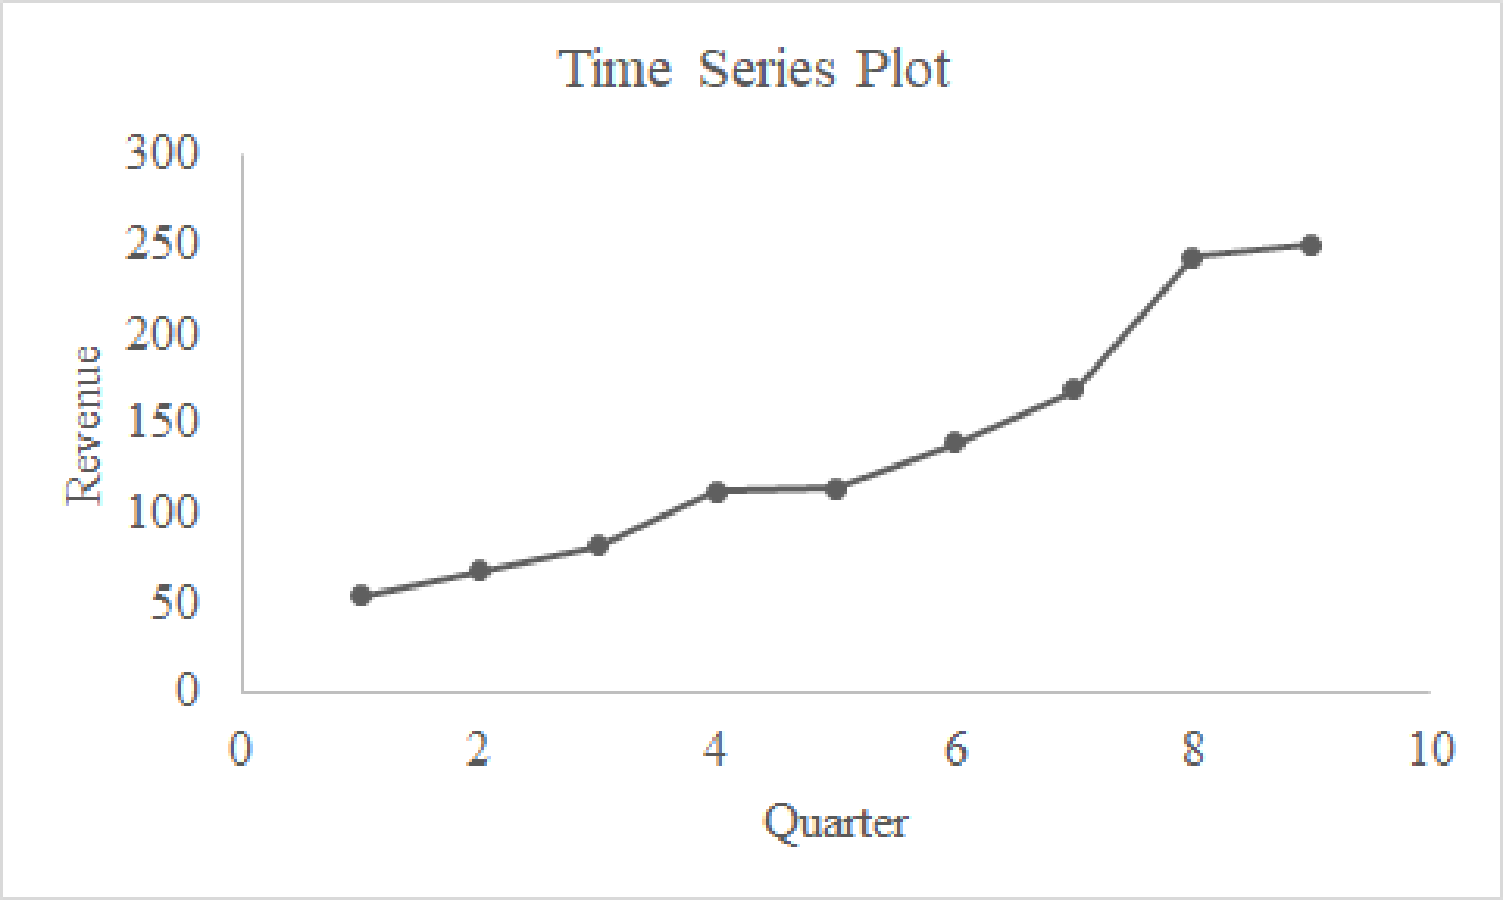
b.
Find the linear trend equation for the data.
Answer to Problem 25E
The linear trend equation is
Explanation of Solution
Calculation:
The linear trend equation is to be obtained.
Software procedure:
Step-by-step software procedure to find the linear trend equation using EXCEL:
- Open an EXCEL file.
- In column A, enter the data of Quarter, and in column B, enter the corresponding values of Revenue.
- Select the data that are to be displayed.
- Click on the Insert Tab > select Scatter icon.
- Choose a Scatter with Straight Lines and Markers.
- Click on the chart > select Layout from the Chart Tools.
- Select Chart Title > Above Chart and enter Time Series Plot.
- Select Axis Title > Primary Horizontal Axis Title > Title Below Axis.
- Enter Quarter in the dialog box.
- Select Axis Title > Primary Vertical Axis Title > Rotated Title.
- Enter Revenue in the dialog box.
- Right Click at any point in the time series plot and select Add Trendline.
- Select Linear under TrendLine Options.
- Choose Display Equation on Chart.
Output using EXCEL is given below:
From the output, the linear trend equation is
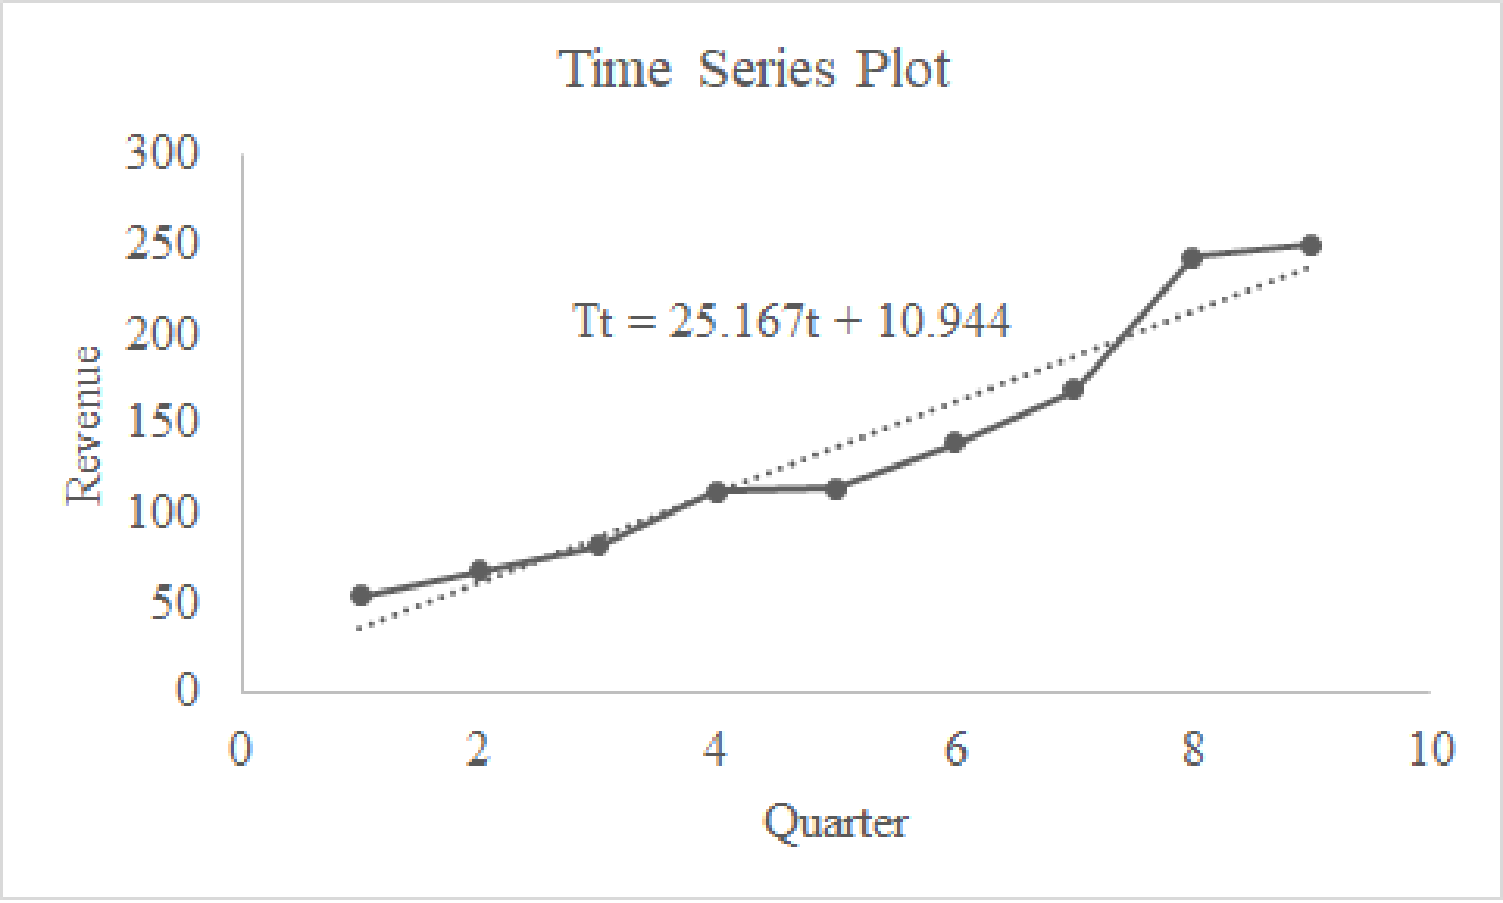
c.
Find the quadratic trend equation for the data.
Answer to Problem 25E
The quadratic trend equation is
Explanation of Solution
Calculation:
The quadratic trend equation is to be obtained.
Software procedure:
Step-by-step software procedure to find the linear trend equation using EXCEL:
- Open an EXCEL file.
- In column A, enter the data of Quarter, and in column B, enter the corresponding values of Revenue.
- Select the data that are to be displayed.
- Click on the Insert Tab > select Scatter icon.
- Choose a Scatter with Straight Lines and Markers.
- Click on the chart > select Layout from the Chart Tools.
- Select Chart Title > Above Chart and enter Time Series Plot.
- Select Axis Title > Primary Horizontal Axis Title > Title Below Axis.
- Enter Quarter in the dialog box.
- Select Axis Title > Primary Vertical Axis Title > Rotated Title.
- Enter Revenue in the dialog box.
- Right Click at any point in the time series plot and select Add Trendline.
- Select Polynomial and enter Order as 2 under TrendLine Options.
- Choose Display Equation on Chart.
Output using EXCEL is given below:
From the output, the quadratic trend equation is
d.
Identify the model that appears better according to MSE.
Answer to Problem 25E
The quadratic model that appears better according to MSE.
Explanation of Solution
Calculation:
The formula for finding mean square error (MSE) is as follows:
For linear trend model:
Software procedure:
Step-by-step procedure to obtain MSE using EXCEL:
- In column A, enter the data of Quarter, and in column B, enter the corresponding values of Revenue.
- In Data, select Data Analysis and choose Regression.
- In Input Y Range, select Revenue.
- In Input X Range, select Quarter.
- Select Labels.
- Click OK.
Output obtained using EXCEL is given below:
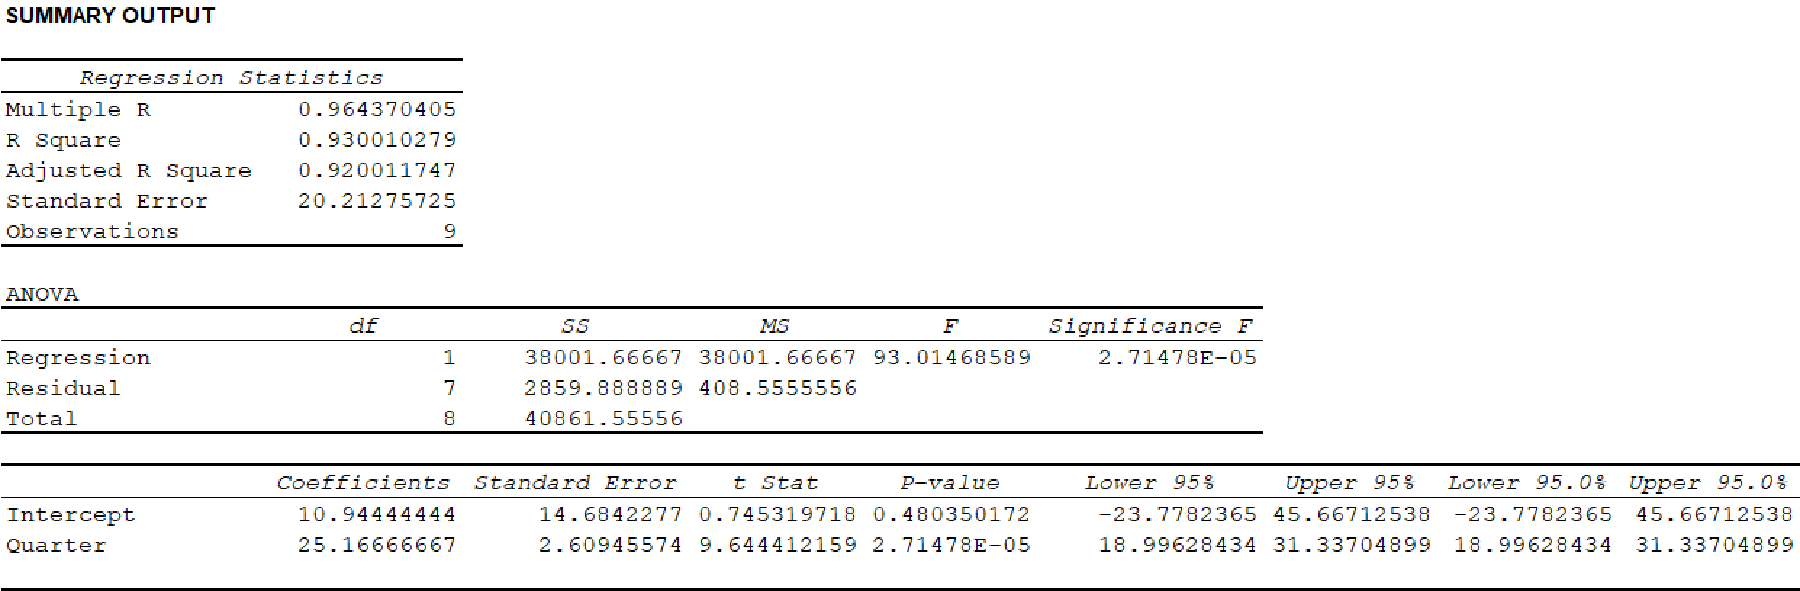
From the output, the MSE is 408.5556.
For Quadratic trend model:
Software procedure:
Step-by-step procedure to obtain MSE using EXCEL:
- In column A, enter the data of Quarter, in column B, enter the data of Quarter Square and in column C, enter the corresponding values of Revenue.
- In Data, select Data Analysis and choose Regression.
- In Input Y Range, select Revenue.
- In Input X Range, select Quarter and Quarter Square.
- Select Labels.
- Click OK.
Output obtained using EXCEL is given below:
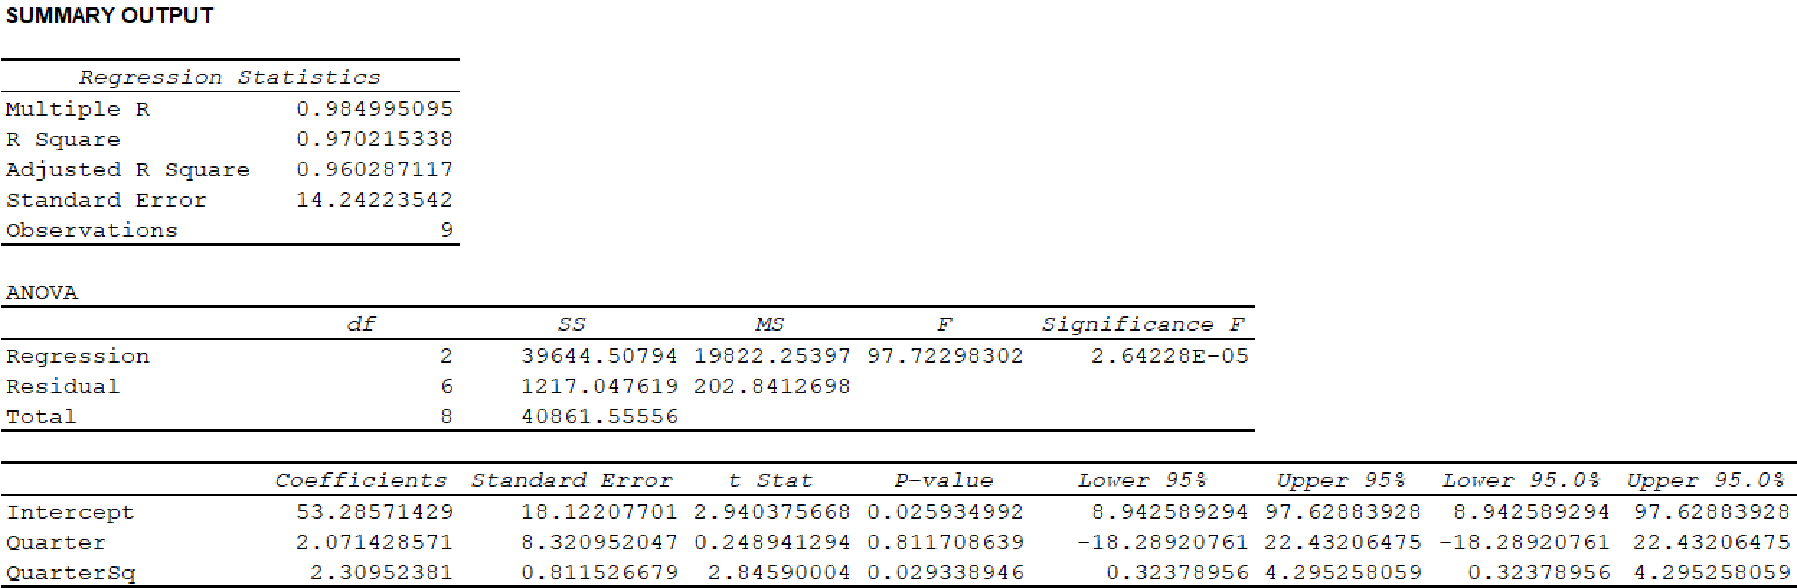
From the output, MSE is 202.8413.
Here, MSE for the quadratic trend equation is less than MSE for the linear trend equation. Hence, the quadratic model provides more accurate forecasts based on MSE.
e.
Find the forecast revenue for the tenth quarter using the models developed in Parts (b) and (c).
Answer to Problem 25E
The forecast revenue for the tenth quarter using the linear model is 262.614.
The forecast revenue for the tenth quarter using the quadratic model is 304.95.
Explanation of Solution
Calculation:
From the results of Part (b), the trend line equation is
The forecast revenue for the tenth quarter using the linear model is obtained as follows:
Thus, the forecast revenue for the tenth quarter using the linear model is 262.614.
From the results of Part (b), the trend line equation is
The forecast revenue for the tenth quarter using the quadratic model is obtained as follows:
Thus, the forecast revenue for the tenth quarter using the linear model is 262.614.
f.
Identify the forecast that is used in Part (e).
Answer to Problem 25E
The forecast revenue for the tenth quarter using the quadratic models is used.
Explanation of Solution
From Part (d), MSE for the quadratic trend equation is less than MSE for the linear trend equation. Hence, the quadratic model provides more accurate forecasts based on MSE. Thus, the forecast revenue for the tenth quarter using the quadratic models is used.
Want to see more full solutions like this?
Chapter 17 Solutions
Bundle: Modern Business Statistics With Microsoft Office Excel, Loose-leaf Version, 6th + Cengagenow, 2 Terms Printed Access Card


- Table 6 shows the year and the number ofpeople unemployed in a particular city for several years. Determine whether the trend appears linear. If so, and assuming the trend continues, in what year will the number of unemployed reach 5 people?arrow_forwardThe US. import of wine (in hectoliters) for several years is given in Table 5. Determine whether the trend appearslinear. Ifso, and assuming the trend continues, in what year will imports exceed 12,000 hectoliters?arrow_forwardthe table shows the percent of households with internet access for selected years from 2009 and projected through 2015. Year Percent of households 2009 67 2010 70 2011 72.5 2012 75 2013 76.5 2014 77.2 2015 78 Use the model to predict the percent of households with internet access in 2022.arrow_forward
- Amex PLC has gathered following information on the sales of face mask from April 2020 toSeptember 2020.Month Sales ($)April 17,000May 18,000June 19,500July 22,000August 21,000September 23,000You are required to;a. Using linear trend equation forecast the sales of face masks for October 2020.arrow_forwardFind out the next month after april income by using the forecasting method of the moving average methodarrow_forwardU.S. Civilian Labor Force (thousands)Year Labor Force Year Labor Force2007 173,966 2012 175,6762008 174,703 2013 175,1992009 173,159 2014 176,2862010 173,698 2015 178,0052011 174,043 2016 179,688 Make forecasts using the following fitted trend models for years 2017-2019. t Linear Quadratic Exponential 111213arrow_forward
- Which of the following time series forecasting methods would not be used to forecast seasonal data?arrow_forwardU.S. Civilian Labor Force (thousands) Year Labor Force Year Labor Force 2007 153,918 2012 155,628 2008 154,655 2013 155,151 2009 153,111 2014 156,238 2010 153,650 2015 157,957 2011 153,995 2016 159,640 1. Fit three trend models: linear, exponential, and quadratic. Which model would offer the most believable forecasts? 2. Make forecasts using the following fitted trend models for years 2017-2019. t Exponential 11 12 13arrow_forwardDetermine the linear trend equation and then interpret it.arrow_forward
- The sales records of a major auto manufacturer over the past years from 2005 to 2019 are shown below. Number of Cars Sold Year (In thousands of Units) 2005 195 2006 200 2007 250 2008 270 2009 320 2010 380 2011 440 2012 460 2013 500 2014 500 2015 550 2016 570 2017 600 2018 650 2019 700 Develop moving average with k=4 and compute its MSE Develop exponential model with α = 0.4 and compute its MSE Develop a linear trend model and compute its MSE Based on the MSE computed fore ach model , which model fits well to the data Based on the answer of question (4) forecast the number of cars sold for year 2020.arrow_forwardCoca-Cola Revenues ($ millions), 2014 to 2019 Quarter 2014 2015 2016 2017 2018 2019 Quarter 1 10.58 9.94 10.28 9.12 7.63 8.02 Quarter 2 12.57 11.63 11.54 9.70 9.42 10.00 Quarter 3 11.98 11.77 10.63 9.08 8.78 9.51 Quarter4 10.87 10.13 9.41 7.51 5.36 9.07 What is the trend model for the deseasonalized time series? (Round your answers to 2 decimal places.) State the model found when performing a regression using seasonal binaries. (A negative value should be indicated by a minus sign. Round your answers to 4 decimal places.) Use the regression equation to make a prediction for each quarter in 2020. (Enter your answers in millions rounded to 3 decimal places.)arrow_forwardWhat is the ratio of the total jobs at risk in Transportation and Storage to those at riks in Retail? A) 4.68:7.79 B) 7.79:4.68 C) 52:41 D) 9:19 E) 30:27 Transcribed Image Text:Likelihood of industries becoming automated in the future Proportion of jobs and their risk of automation. Note: the graph shows a linear decrease in the proportion of jobs at risk of full automation. 60% 55% 50% 45% 40% 35% 30% 25% 20% 15% 10% 5% 0% Transportation and Storage Series Value Proportion of Jobs at Risk of Full Automation 52% Employment Share of Total Jobs Waste Management Transportation and 9% Manufacturing Retail Administration Finance and Insurance ch Other Electricity and Gas Transcribed Image Text:Likelihood of industries becoming automated in the future Proportion of jobs and their risk of automation. Note: the graph shows a linear decrease in the proportion of jobs at risk of full automation. 60% 55% 50% 45% 40% 35% 30% 25% 20% 15% 10% 5% 0% Waste Management Transportation and Retail…arrow_forward

 Glencoe Algebra 1, Student Edition, 9780079039897...AlgebraISBN:9780079039897Author:CarterPublisher:McGraw Hill