
EBK STATISTICS FOR BUSINESS & ECONOMICS
12th Edition
ISBN: 9780100460461
Author: Anderson
Publisher: YUZU
expand_more
expand_more
format_list_bulleted
Videos
Textbook Question
Chapter 17.6, Problem 36E
Refer to exercise 35.
- a. Deseasonalize the time series using the adjusted seasonal indexes computed in part (c) of exercise 35.
- b. Using Minitab or Excel, compute the linear trend regression equation for the deseasonalized data.
- c. Compute the deseasonalized quarterly trend forecast for year 4.
- d. Use the seasonal indexes to adjust the deseasonalized trend forecasts computed in part (c).
35. Consider the following time series data.
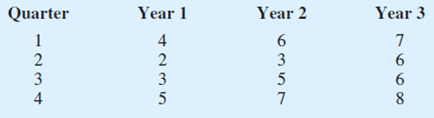
- a. Construct a time series plot. What type of pattern exists in the data?
- b. Show the four-quarter and centered moving average values for this time series.
- c. Compute seasonal indexes and adjusted seasonal indexes for the four quarters.
Expert Solution & Answer

Trending nowThis is a popular solution!

Students have asked these similar questions
Using the photo attached, One Stop Car Repairs ollects data on the actual demand for its services and uses this data to make forecasts. The actual number of transmissions that were repaired for the last ten periods IS ATTACHED IN THE PHOTO
answer the following.
1. Using the trend projection manual method, forecast demand for transmission repairs for periods 11 and 12
Chapter 17 Solutions
EBK STATISTICS FOR BUSINESS & ECONOMICS
Ch. 17.2 - Consider the following time series data. Week 1 2...Ch. 17.2 - Refer to the time series data in exercise 1. Using...Ch. 17.2 - Exercises 1 and 2 used different forecasting...Ch. 17.2 - Consider the following time series data. Month 1 2...Ch. 17.3 - Consider the following time series data. Week 1 2...Ch. 17.3 - Consider the following time series data. Month 1 2...Ch. 17.3 - Refer to the gasoline sales time series data in...Ch. 17.3 - Refer again to the gasoline sales time series data...Ch. 17.3 - With the gasoline time series data from Table...Ch. 17.3 - With a smoothing constant of = .2, equation...
Ch. 17.3 - For the Hawkins Company, the monthly percentages...Ch. 17.3 - Corporate triple-A bond interest rates for 12...Ch. 17.3 - The values of Alabama building contracts (in ...Ch. 17.3 - The following time series shows the sales of a...Ch. 17.3 - Ten weeks of data on the Commodity Futures Index...Ch. 17.3 - The U.S. Census Bureau tracks the median price for...Ch. 17.4 - Consider the following time series data. a....Ch. 17.4 - Prob. 18ECh. 17.4 - Consider the following time series. a. Construct a...Ch. 17.4 - Prob. 20ECh. 17.4 - Prob. 21ECh. 17.4 - Prob. 22ECh. 17.4 - The president of a small manufacturing firm is...Ch. 17.4 - FRED (Federal Reserve Economic Data), a database...Ch. 17.4 - Automobile unit sales at B. J. Scott Motors, Inc.,...Ch. 17.4 - Giovanni Food Products produces and sells frozen...Ch. 17.4 - Prob. 27ECh. 17.5 - Consider the following time series. a. Construct a...Ch. 17.5 - Consider the following time series data. a....Ch. 17.5 - The quarterly sales data (number of copies sold)...Ch. 17.5 - Air pollution control specialists in southern...Ch. 17.5 - South Shore Construction builds permanent docks...Ch. 17.5 - Prob. 33ECh. 17.5 - Three years of monthly lawn-maintenance expenses...Ch. 17.6 - Consider the following time series data. a....Ch. 17.6 - Refer to exercise 35. a. Deseasonalize the time...Ch. 17.6 - The quarterly sales data (number of copies sold)...Ch. 17.6 - Three years of monthly lawn-maintenance expenses...Ch. 17.6 - Air pollution control specialists in southern...Ch. 17.6 - Electric power consumption is measured in...Ch. 17 - The weekly demand (in cases) for a particular...Ch. 17 - The following table reports the percentage of...Ch. 17 - United Dairies. Inc., supplies milk to several...Ch. 17 - Prob. 44SECh. 17 - Prob. 45SECh. 17 - The Mayfair Department Store in Davenport, Iowa,...Ch. 17 - Canton Supplies, Inc., is a service firm that...Ch. 17 - The Costello Music Company has been in business...Ch. 17 - Consider the Costello Music Company problem in...Ch. 17 - Refer to the Costello Music Company problem in...Ch. 17 - Refer to the Costello Music Company time series in...Ch. 17 - Hudson Marine has been an authorized dealer for CD...Ch. 17 - Refer to the Hudson Marine problem in exercise 52....Ch. 17 - Refer to the Hudson Marine problem in exercise 53....Ch. 17 - Refer to the Hudson Marine data in exercise 53. a....Ch. 17 - Forecasting Food and Beverage Sales The Vintage...Ch. 17 - Forecasting Lost Sales The Carlson Department...
Knowledge Booster


Learn more about
Need a deep-dive on the concept behind this application? Look no further. Learn more about this topic, statistics and related others by exploring similar questions and additional content below.Similar questions
- The US. import of wine (in hectoliters) for several years is given in Table 5. Determine whether the trend appearslinear. Ifso, and assuming the trend continues, in what year will imports exceed 12,000 hectoliters?arrow_forwardLife Expectancy The following table shows the average life expectancy, in years, of a child born in the given year42 Life expectancy 2005 77.6 2007 78.1 2009 78.5 2011 78.7 2013 78.8 a. Find the equation of the regression line, and explain the meaning of its slope. b. Plot the data points and the regression line. c. Explain in practical terms the meaning of the slope of the regression line. d. Based on the trend of the regression line, what do you predict as the life expectancy of a child born in 2019? e. Based on the trend of the regression line, what do you predict as the life expectancy of a child born in 1580?2300arrow_forwardWhat does the y -intercept on the graph of a logistic equation correspond to for a population modeled by that equation?arrow_forward
- Does Table 1 represent a linear function? If so, finda linear equation that models the data.arrow_forwardEXERCISES The following table gives the life expectancy at birth of females born in the United States in various years from 1970 to 2010. Source: National Center for Health Statistics. Year of Birth Life Expectancy years 1970 74.7 1975 76.6 1980 77.4 1985 78.2 1990 78.8 1995 78.9 2000 79.3 2005 79.9 2010 81.0 Find the life expectancy predicted by your regression equation for each year in the table, and subtract it from the actual value in the second column. This gives you a table of residuals. Plot your residuals as points on a graph.arrow_forwardFind the equation of the regression line for the following data set. x 1 2 3 y 0 3 4arrow_forward
arrow_back_ios
arrow_forward_ios
Recommended textbooks for you
 Functions and Change: A Modeling Approach to Coll...AlgebraISBN:9781337111348Author:Bruce Crauder, Benny Evans, Alan NoellPublisher:Cengage Learning
 Calculus For The Life SciencesCalculusISBN:9780321964038Author:GREENWELL, Raymond N., RITCHEY, Nathan P., Lial, Margaret L.Publisher:Pearson Addison Wesley,
 Glencoe Algebra 1, Student Edition, 9780079039897...AlgebraISBN:9780079039897Author:CarterPublisher:McGraw Hill
 Algebra and Trigonometry (MindTap Course List)AlgebraISBN:9781305071742Author:James Stewart, Lothar Redlin, Saleem WatsonPublisher:Cengage Learning
 Algebra & Trigonometry with Analytic GeometryAlgebraISBN:9781133382119Author:SwokowskiPublisher:Cengage
Functions and Change: A Modeling Approach to Coll...
Algebra
ISBN:9781337111348
Author:Bruce Crauder, Benny Evans, Alan Noell
Publisher:Cengage Learning
Calculus For The Life Sciences
Calculus
ISBN:9780321964038
Author:GREENWELL, Raymond N., RITCHEY, Nathan P., Lial, Margaret L.
Publisher:Pearson Addison Wesley,
Glencoe Algebra 1, Student Edition, 9780079039897...
Algebra
ISBN:9780079039897
Author:Carter
Publisher:McGraw Hill
Algebra and Trigonometry (MindTap Course List)
Algebra
ISBN:9781305071742
Author:James Stewart, Lothar Redlin, Saleem Watson
Publisher:Cengage Learning
Algebra & Trigonometry with Analytic Geometry
Algebra
ISBN:9781133382119
Author:Swokowski
Publisher:Cengage
Time Series Analysis Theory & Uni-variate Forecasting Techniques; Author: Analytics University;https://www.youtube.com/watch?v=_X5q9FYLGxM;License: Standard YouTube License, CC-BY
Operations management 101: Time-series, forecasting introduction; Author: Brandoz Foltz;https://www.youtube.com/watch?v=EaqZP36ool8;License: Standard YouTube License, CC-BY