
OPERATIONS MANAGEMENT (LL) W/CONNECT
14th Edition
ISBN: 9781265502942
Author: Stevenson
Publisher: MCG CUSTOM
expand_more
expand_more
format_list_bulleted
Concept explainers
Videos
Textbook Question
Chapter 18, Problem 16P
A priority waiting system assigns arriving customers to one of four classes. Arrival rates (Poisson) of the classes are shown in the following table. Five servers process the customers, and each can handle three customers per hour.
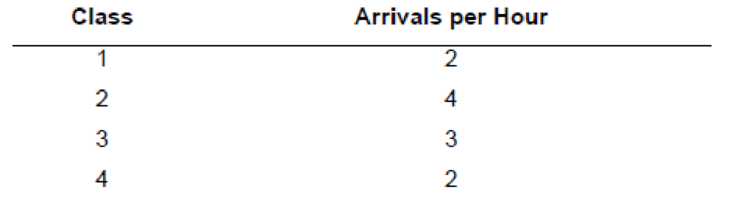
a. What is the system utilization?
b. What is the average wait for service by customers in the various classes? How many are waiting in each class, on average?
c. If the arrival rate of the second priority class could be reduced to three units per hour by shifting some arrivals into the third priority class, how would your answers to part b change?
d. What observations can you make based on your answers to part c?
Expert Solution & Answer
Want to see the full answer?
Check out a sample textbook solution
Students have asked these similar questions
In an M/M/1 queueing system, the arrival rate is 3 customers per hour and the service rate is 5 customers per hour.
a. What is the utilization? (round your answer to 3 decimal places)
b. What is the expected number of customers in the system (L)? (round your answer to 3 decimal places)
c. What is the expected waiting time in the system (W)? (express the waiting time in hours, round your answer to 3 decimal places)
d. What is the expected number of customers in the queue (Lq)? (round your answer to 3 decimal places)
e. What is the expected waiting time in the queue (Wq)? (express the waiting time in hours, round your answer to 3 decimal places)
Discuss how the design of a waiting system can negatively affect customers?
A branch office of a large engineering firm has one on-line terminal connected to a central computer
system for 16 hours each day. Engineers drive to the branch office to use the terminal to make routine
calculations with an average exponential distribution of 30 minutes per use. The daily arrival pattern of
engineers is random (Poisson) with an average of 20 persons.
The branch manager is starting to receive complaints from the engineers about the length of time many
of them have to wait to use the terminal.
Question:
1. What is and u measured in per hour intervals?
2. On the average, how many minutes does each engineer have to wait?
3. Using increments of 0.1 hours, what would be the least value of u so that the waiting time will be
not exceed 30 minutes?
Chapter 18 Solutions
OPERATIONS MANAGEMENT (LL) W/CONNECT
Ch. 18.1 - Prob. 1.1RQCh. 18.1 - Prob. 1.2RQCh. 18 - Prob. 1DRQCh. 18 - Why do waiting lines form even though a service...Ch. 18 - Prob. 3DRQCh. 18 - Prob. 4DRQCh. 18 - What approaches do supermarkets use to offset...Ch. 18 - Prob. 6DRQCh. 18 - Prob. 7DRQCh. 18 - Prob. 8DRQ
Ch. 18 - Prob. 9DRQCh. 18 - Prob. 1TSCh. 18 - Prob. 2TSCh. 18 - Prob. 3TSCh. 18 - Prob. 1CTECh. 18 - Prob. 2CTECh. 18 - Prob. 3CTECh. 18 - The owner of Eat Now Restaurant implemented an...Ch. 18 - Prob. 5CTECh. 18 - Prob. 1PCh. 18 - Prob. 2PCh. 18 - Prob. 3PCh. 18 - Prob. 4PCh. 18 - Prob. 5PCh. 18 - Prob. 6PCh. 18 - Prob. 7PCh. 18 - Prob. 8PCh. 18 - Prob. 9PCh. 18 - Prob. 10PCh. 18 - Prob. 11PCh. 18 - Prob. 12PCh. 18 - Prob. 13PCh. 18 - Prob. 14PCh. 18 - Prob. 15PCh. 18 - A priority waiting system assigns arriving...Ch. 18 - Prob. 17PCh. 18 - Prob. 18PCh. 18 - Prob. 1CQ
Knowledge Booster


Learn more about
Need a deep-dive on the concept behind this application? Look no further. Learn more about this topic, operations-management and related others by exploring similar questions and additional content below.Recommended textbooks for you
 Practical Management ScienceOperations ManagementISBN:9781337406659Author:WINSTON, Wayne L.Publisher:Cengage,
 MarketingMarketingISBN:9780357033791Author:Pride, William MPublisher:South Western Educational Publishing
Practical Management Science
Operations Management
ISBN:9781337406659
Author:WINSTON, Wayne L.
Publisher:Cengage,
Marketing
Marketing
ISBN:9780357033791
Author:Pride, William M
Publisher:South Western Educational Publishing
Inventory Management | Concepts, Examples and Solved Problems; Author: Dr. Bharatendra Rai;https://www.youtube.com/watch?v=2n9NLZTIlz8;License: Standard YouTube License, CC-BY