
Concept explainers
Videos
Interpreting Rates of Change on a Graph A car is traveling from New York to Boston and is partway between the two cities. Let
in Fig. 7.
The car travels at a positive steady speed.
The car is stopped.
The car is backing up.
The car is accelerating.
The car is decelerating.
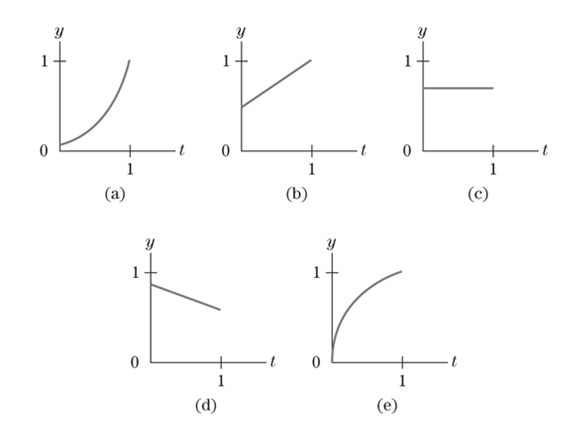
Figure 7 Possible graphs of

Trending nowThis is a popular solution!

Chapter 1 Solutions
MyLab Math with Pearson eText -- 24 Month Access -- for Calculus & Its Applications


- Earthquake the graph shows the vertical acceleration of the Ground from the 1994 Northridge earthquake in Los Angles, as measured by a seismograph. (Here t represents the time in seconds.) (a) At what time t did the earthquake first make noticeable movement of the Earth? (b) At what time t did the earthquakes seem to end? (c) At what time t was the maximum intensity of the earthquake list reachedarrow_forwardImmigration The following graph shows immigrationin thousand to the United States has varied over the past century. Source: Homeland Security. a. Find the average annual rate of change in immigration for the first half of the century from 1905 to 1955. b. Find the average annual rate of change in immigration for the second half of the century from 1955 to 2005. c. Find the average annual rate of change in immigration for the entire century from 1905 to 2005. d. Average your answers to part a and b, and compare the result with your answer from part c. Will these always be equal for any two time periods? e. If the annual average rate of change for entire century continues, predict the number of immigrants in 2009. Compare answer to the actual number of 1,130,818 immigrants.arrow_forwardTraffic The following graph shows the number of vehicles per hour crossing the Tappan Zee Bridge, which spans the Hudson River north of New York City. The graph shows the number of vehicles traveling eastbound into the city and westbound out of the city as a function of time. Source: The New York Times. a. Using midpoints on intervals of one hour, estimate the total number of vehicles that cross the bridge going eastbound each day. b. Repeat the instructions for part a for vehicles going westbound. c. Discuss whether the answers to parts a and b should be equal, and try to explain any discrepancies. d. e.arrow_forward
 Calculus For The Life SciencesCalculusISBN:9780321964038Author:GREENWELL, Raymond N., RITCHEY, Nathan P., Lial, Margaret L.Publisher:Pearson Addison Wesley,
 Algebra & Trigonometry with Analytic GeometryAlgebraISBN:9781133382119Author:SwokowskiPublisher:Cengage
 Algebra and Trigonometry (MindTap Course List)AlgebraISBN:9781305071742Author:James Stewart, Lothar Redlin, Saleem WatsonPublisher:Cengage Learning
 College AlgebraAlgebraISBN:9781305115545Author:James Stewart, Lothar Redlin, Saleem WatsonPublisher:Cengage Learning