
Concept explainers
Videos
Interpreting Rates of Change on a Graph A car is traveling from New York to Boston and is partway between the two cities. Let
in Fig. 7.
The car travels at a positive steady speed.
The car is stopped.
The car is backing up.
The car is accelerating.
The car is decelerating.
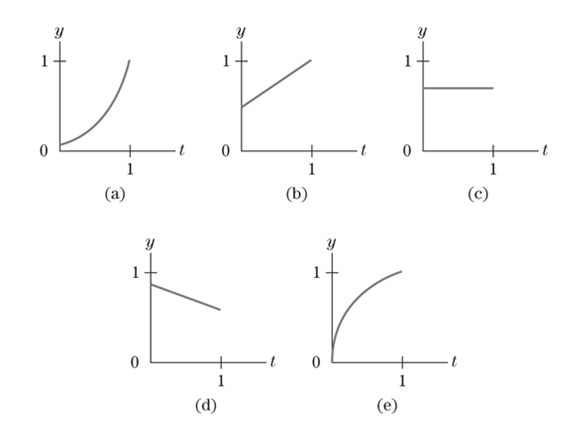
Figure 7 Possible graphs of

Trending nowThis is a popular solution!

Chapter 1 Solutions
Student Solutions Manual for Calculus & Its Applications and Calculus & Its Applications, Brief Version


- World Crude Oil Production In 1956, M.King Hubbert proposed a model to analyse crude oil production. His model, with updated data, gives world crude oil production as P=254.43e0.042t(1+2.12e0.042t)2 Here P is measured in billions of barrels per year, and t is time, in year, since 2000. a.Make a graph of world crude oil production for 2000 through 2040. b.When does this model predict a peak in world crude oil production? c.What is the maximum crude oil production predicted by this model?arrow_forwardA Population of Foxes A breeding group of foxes is introduced into a protected area, and the population growth follws a logistic pattern. After t years, the population of foxes is given by N=37.50.25+0.76t foxes. a. How many foxes were intorduced into the protected area? b. Make a graph of N versus t and explain in words how the populatoin of foxes increases with time. c. When will the fox population reach 100 individuals?arrow_forwardSales Growth In this exercise, we develop a model for the growth rate G, in thousands of dollars per year, in sales of the product as a function of the sales level s, in thousands of dollars. The model assumes that there is a limit to the total amount of sales that can be attained. In this situation, we use the term unattained sales for difference this limit and the current sales level. For example, if we expect sales grow to 3 thousand dollars in the long run, then 3-s is the unattained sales. The model states that the growth rate G is proportional to the product of the sales level s, and the unattained sales. Assume that the constant of proportionality is 0.3 and that the sales grow to 2 thousand dollars in the long run. a.Find the formula for unattained sales. b.Write an equation that shows the proportionality relation for G. c.On the basis of the equation from the part b, make a graph of G as a function of s. d.At what sales level is the growth rate as large as possible? e.What is the largest possible growth rate?arrow_forward
 Algebra & Trigonometry with Analytic GeometryAlgebraISBN:9781133382119Author:SwokowskiPublisher:Cengage
 Functions and Change: A Modeling Approach to Coll...AlgebraISBN:9781337111348Author:Bruce Crauder, Benny Evans, Alan NoellPublisher:Cengage Learning
 College AlgebraAlgebraISBN:9781305115545Author:James Stewart, Lothar Redlin, Saleem WatsonPublisher:Cengage Learning
 Algebra and Trigonometry (MindTap Course List)AlgebraISBN:9781305071742Author:James Stewart, Lothar Redlin, Saleem WatsonPublisher:Cengage Learning
 Trigonometry (MindTap Course List)TrigonometryISBN:9781337278461Author:Ron LarsonPublisher:Cengage Learning