
To draw: The graphs showing a stationary trend, a positive trend, and a negative trend. And label them.
Explanation of Solution
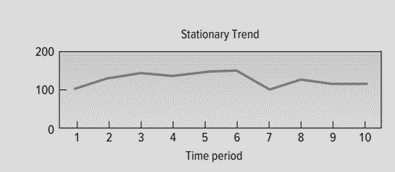
Trend analysis is an important component or technique of Time Series, which uses past data to predict the future. It indicates the change in a variable over a given time period. It may be stationary, positive, or negative.
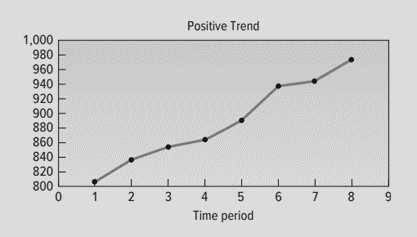
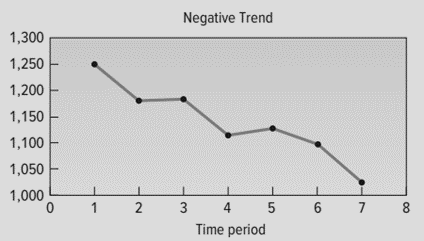
A positive trend is one in which a rise in one set of data results in an increase in the other set. And a negative trend is one in which a rise in one set of data results in a decrease in the other set. On the other hand, if one set of data rises but the other does not appear to rise or fall, a trend is not there.
Graph:
The graph representing the stationary trend is:
The graph representing a positive or upward trend is:
The graph representing a negative or downward trend is:
Want to see more full solutions like this?
Chapter 18 Solutions
LIND 18E STATISTICAL TECHNIQUES IN BUSIN

 Glencoe Algebra 1, Student Edition, 9780079039897...AlgebraISBN:9780079039897Author:CarterPublisher:McGraw Hill
 Big Ideas Math A Bridge To Success Algebra 1: Stu...AlgebraISBN:9781680331141Author:HOUGHTON MIFFLIN HARCOURTPublisher:Houghton Mifflin Harcourt