
Statistical Techniques in Business and Economics
16th Edition
ISBN: 9780077639723
Author: Lind
Publisher: Mcgraw-Hill Course Content Delivery
expand_more
expand_more
format_list_bulleted
Concept explainers
Videos
Question
Chapter 18, Problem 1SR
To determine
Obtain the three-year moving average.
Draw a graph for both original data and the moving average.
Expert Solution & Answer
Answer to Problem 1SR
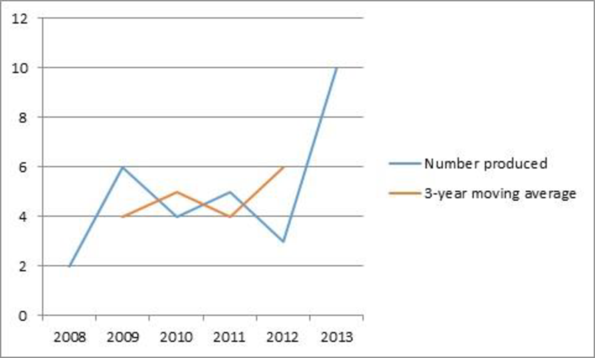
The three-year moving averages are 4, 5, 4, and 6.
The plot for original data and the moving average is shown below:
Explanation of Solution
Moving average:
It is used to smooth the fluctuations in time series data in order to see its trend.
The three-year moving averages for sales are obtained below:
| Year | Number Produced | 3-year moving average |
| 2008 | 2 | — |
| 2009 | 6 | |
| 2010 | 4 | |
| 2011 | 5 | |
| 2012 | 3 | |
| 2013 | 10 | — |
Step-by-step procedure to draw the
- Enter the data for year, number produced, and 3-year moving averages in an Excel sheet.
- Select the columns of “Number Produced” and “3-year moving average”.
- Go to Insert menu.
- Select Line chart.
Thus, the plot for original data and the moving averages are obtained.
Want to see more full solutions like this?
Subscribe now to access step-by-step solutions to millions of textbook problems written by subject matter experts!
Chapter 18 Solutions
Statistical Techniques in Business and Economics
Ch. 18 - Prob. 1SRCh. 18 - Calculate a four-quarter weighted moving average...Ch. 18 - Prob. 2ECh. 18 - Prob. 2SRCh. 18 - Prob. 3ECh. 18 - Prob. 4ECh. 18 - Prob. 5ECh. 18 - Prob. 6ECh. 18 - Sales at Tomlin Manufacturing from 2009 to 2013...Ch. 18 - Prob. 7E
Ch. 18 - Prob. 8ECh. 18 - Prob. 4SRCh. 18 - Prob. 9ECh. 18 - Prob. 10ECh. 18 - Prob. 5SRCh. 18 - Prob. 11ECh. 18 - Prob. 12ECh. 18 - Refer to Exercise 9 regarding the absences at...Ch. 18 - Prob. 14ECh. 18 - Prob. 15ECh. 18 - Prob. 16ECh. 18 - Prob. 17CECh. 18 - Prob. 18CECh. 18 - Prob. 19CECh. 18 - Prob. 20CECh. 18 - Prob. 21CECh. 18 - Prob. 22CECh. 18 - Prob. 23CECh. 18 - Prob. 24CECh. 18 - Prob. 25CECh. 18 - Prob. 26CECh. 18 - Prob. 27CECh. 18 - The quarterly production of pine lumber, in...Ch. 18 - Prob. 29CECh. 18 - Sales of roof material, by quarter, for 2007...Ch. 18 - Blueberry Farms Golf and Fish Club of Hilton Head,...Ch. 18 - Prob. 32CECh. 18 - Ray Anderson, owner of Anderson Ski Lodge in...Ch. 18 - Prob. 34CECh. 18 - Prob. 35CECh. 18 - Prob. 36CECh. 18 - Consider the variable mean amount per transaction...Ch. 18 - Prob. 38CECh. 18 - Prob. 39DECh. 18 - Prob. 1PCh. 18 - Prob. 2PCh. 18 - Prob. 3PCh. 18 - Prob. 1.1PTCh. 18 - Prob. 1.2PTCh. 18 - Prob. 1.3PTCh. 18 - Prob. 1.4PTCh. 18 - Prob. 1.5PTCh. 18 - Prob. 1.6PTCh. 18 - Prob. 1.7PTCh. 18 - Prob. 1.8PTCh. 18 - Prob. 1.9PTCh. 18 - Prob. 1.10PTCh. 18 - Prob. 2.1PTCh. 18 - Listed below are the price and quantity of several...Ch. 18 - Prob. 2.3PT
Knowledge Booster


Learn more about
Need a deep-dive on the concept behind this application? Look no further. Learn more about this topic, statistics and related others by exploring similar questions and additional content below.Recommended textbooks for you
 Holt Mcdougal Larson Pre-algebra: Student Edition...AlgebraISBN:9780547587776Author:HOLT MCDOUGALPublisher:HOLT MCDOUGAL
 Big Ideas Math A Bridge To Success Algebra 1: Stu...AlgebraISBN:9781680331141Author:HOUGHTON MIFFLIN HARCOURTPublisher:Houghton Mifflin Harcourt
 Glencoe Algebra 1, Student Edition, 9780079039897...AlgebraISBN:9780079039897Author:CarterPublisher:McGraw Hill
Holt Mcdougal Larson Pre-algebra: Student Edition...
Algebra
ISBN:9780547587776
Author:HOLT MCDOUGAL
Publisher:HOLT MCDOUGAL
Big Ideas Math A Bridge To Success Algebra 1: Stu...
Algebra
ISBN:9781680331141
Author:HOUGHTON MIFFLIN HARCOURT
Publisher:Houghton Mifflin Harcourt
Glencoe Algebra 1, Student Edition, 9780079039897...
Algebra
ISBN:9780079039897
Author:Carter
Publisher:McGraw Hill
Which is the best chart: Selecting among 14 types of charts Part II; Author: 365 Data Science;https://www.youtube.com/watch?v=qGaIB-bRn-A;License: Standard YouTube License, CC-BY