Modern Business Statistics with Microsoft Office Excel (with XLSTAT Education Edition Printed Access Card) (MindTap Course List)
6th Edition
ISBN: 9781337115186
Author: David R. Anderson, Dennis J. Sweeney, Thomas A. Williams, Jeffrey D. Camm, James J. Cochran
Publisher: Cengage Learning
bartleby

Concept explainers

bartleby

Videos

Question
Book Icon
Chapter 19, Problem 16SE

a.

To determine

Find the estimate of the mean when the process is in control.

a.

Expert Solution
Check Mark

Answer to Problem 16SE

The estimate of the mean for the production process that is in control is 95.4.

Explanation of Solution

Calculation:

The means for 20 samples of a production process are provided.

The estimate of the mean for the production process is given below:

μ=x¯n=(95.72+95.44+95.40+95.50+95.56+95.72+95.60+95.24+95.46+95.44+95.80+95.22+94.82+95.78+95.18+95.32+95.08+95.22+95.04+95.46)20=1,90820=95.4

Thus, the estimate of the mean for the production process that is in control is 95.4.

b.

To determine

Construct a x¯ control chart for the production process.

b.

Expert Solution
Check Mark

Answer to Problem 16SE

Output obtained using MINITAB software is given below:

Modern Business Statistics with Microsoft Office Excel (with XLSTAT Education Edition Printed Access Card) (MindTap Course List), Chapter 19, Problem 16SE

Explanation of Solution

Calculation:

Upper control limits for the x¯chart:

UCL=μ+3σn=95.4+30.505=95.4+0.6696=96.07

Lower control limits for the
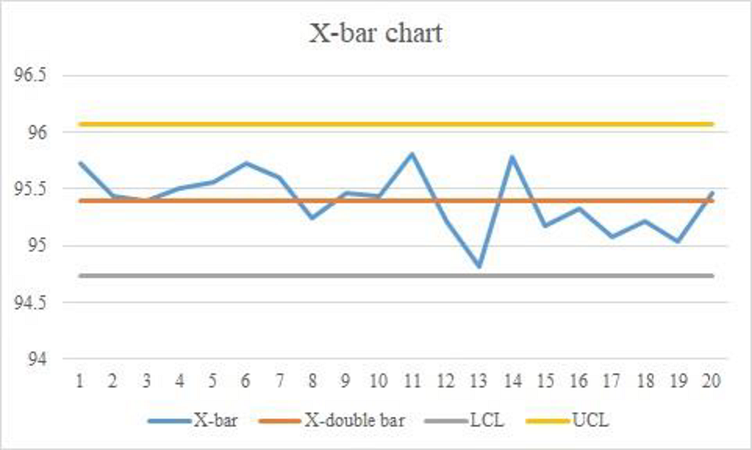
 x¯chart:

LCL=μ3σn=95.430.505=95.40.6696=94.73

X-bar chart:

Software procedure:

Step-by-step software procedure to obtain the X-bar chart using EXCEL:

  • Open an EXCEL file.
  • Enter the observation.
  • Enter X-double bar in a new cell B1, in cell B2 enter a formula “=Average(A2:A21)”.
  • Click Enter.
  • Click on Insert > select Insert Line chart icon.
  • Click on the chart > select Layout from the Chart Tools.
  • Select Chart Title > Above Chart.
  • Enter X-bar Chart in the dialog box.

Thus, the control limits for the x¯ chart are UCL=96.07andLCL=94.73.

c.

To determine

Explain whether any of the 20 sample means indicate that the process is out of control or not.

c.

Expert Solution
Check Mark

Explanation of Solution

From the x¯ chart, it is observed that all the sample means lie within UCL and LCL.

Thus, the 20 sample means do not indicate that the process was out of control.

Want to see more full solutions like this?

Subscribe now to access step-by-step solutions to millions of textbook problems written by subject matter experts!
Knowledge Booster
Background pattern image
Statistics
Learn more about
Need a deep-dive on the concept behind this application? Look no further. Learn more about this topic, statistics and related others by exploring similar questions and additional content below.
Recommended textbooks for you
Text book image
Glencoe Algebra 1, Student Edition, 9780079039897...
Algebra
ISBN:9780079039897
Author:Carter
Publisher:McGraw Hill
Continuous Probability Distributions - Basic Introduction; Author: The Organic Chemistry Tutor;https://www.youtube.com/watch?v=QxqxdQ_g2uw;License: Standard YouTube License, CC-BY
Probability Density Function (p.d.f.) Finding k (Part 1) | ExamSolutions; Author: ExamSolutions;https://www.youtube.com/watch?v=RsuS2ehsTDM;License: Standard YouTube License, CC-BY
Find the value of k so that the Function is a Probability Density Function; Author: The Math Sorcerer;https://www.youtube.com/watch?v=QqoCZWrVnbA;License: Standard Youtube License