
The relationship between the shape of
Explanation of Solution
Figure 1 shows the aggregate demand and supply curve as follows:
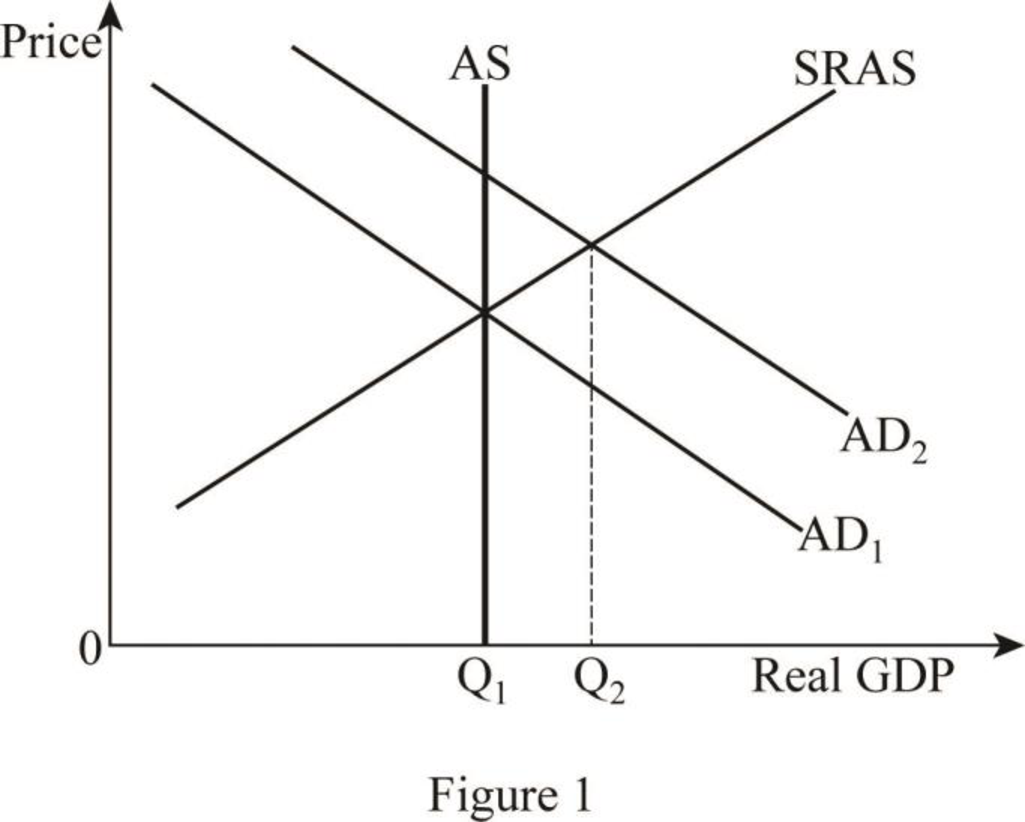
In Figure 1, the vertical axis measures the price and the horizontal axis measures the real GDP. The vertical line “AS” is the long-run
Want to see more full solutions like this?
Chapter 19 Solutions
Bundle: Macroeconomics, Loose-leaf Version, 12th + LMS Integrated MindTap Economics, 1 term (6 months) Printed Access Card


 Economics (MindTap Course List)EconomicsISBN:9781337617383Author:Roger A. ArnoldPublisher:Cengage Learning


 Macroeconomics: Private and Public Choice (MindTa...EconomicsISBN:9781305506756Author:James D. Gwartney, Richard L. Stroup, Russell S. Sobel, David A. MacphersonPublisher:Cengage Learning