
Concept explainers
Videos
Problem 19-5B
Production transactions, subsidiary records, and source documents
P1 P2 P3 P4
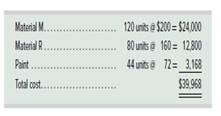
King Company produces variations of its product, a megaton, in response to custom orders from its customers, On June 1, the company had no inventories of work in process or finished goods but held the following raw materials.
On June 3, the company began working on two megatons: Job 450 for Encinita Company and Job 451 for Fargo, Inc.
Required
Using Exhibit 19.3 as a guide, prepare
a. Purchased raw materials on credit and recorded the following information from receiving reports and invoices.
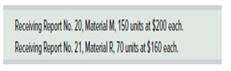
Instructions: Record these purchases with a single
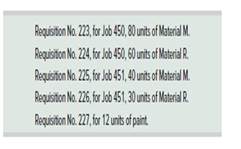
b. Requisitioned the following raw materials for production.
Instructions: Enter amounts for direct materials requisitions on the materials ledger cards and the job cost sheets. Enter the indirect materials amount on the materials ledger card. Do not record a journal entry at this time.
c. Received the following employee time tickets for work in June.
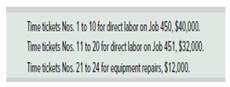
Instructions: Record direct labor from the time tickets on the job cost sheets. Do not record a journal entry at this time.
d. Paid cash for the Mowing items during the month: factory payroll, $84,000, and miscellaneous
Instructions: Record these payments with journal entries.
e. Finished Job 450 and transferred it to the warehouse. The company assigns overhead to each job with a predetermined overhead rate equal to 70% of direct labor cost.
Instructions: Enter the applied overhead on the cost sheet for Job 450, fill in the cost summary section of the cost sheet, and then mark the cost sheet "Finished." Prepare a journal entry to record the job's completion and its transfer to Finished Goods. f. Delivered Job 450 and accepted the customer's promise to pay $290,000 within 30 days,
Instructions: Prepare journal entries to record the sale of Job 450 and the cost of goods sold, g. Applied overhead cost to Job 451 based on the job's direct labor used to date,
Instructions: Enter overhead on the job cost sheet but do not mate a journal entry at tins time. h. Recorded the total direct and indirect materials costs as reported on all the requisitions for the month.
Instructions: Prepare a journal entry to record these. i. Recorded the total overhead costs applied to jobs. Instructions: Prepare a journal entry to record the allocation of these overhead costs. j. Compute the balance in the Factory Overhead account as of the end of June.
Check (h) Dr. Work in Process Inventory, $38,400
(j) Balance in Factory Overhead, $736 Cr., overapplied
Want to see the full answer?
Check out a sample textbook solution
Chapter 19 Solutions
FUND. ACCOUNTING PRINCIPLES >CUSTOM<


- Flowchart of accounts related to service and processing departments Alcoa Inc. is the worlds largest producer of aluminum products. One product that Alcoa manufactures is aluminum sheet products for the aerospace industry. The entire output of the Smelting Department is transferred to the Rolling Department Part of the fully processed goods from the Rolling Department are sold as rolled sheet, and the remainder of the goods are transferred to the Converting Department for further processing into sheared sheet Prepare a chart of the flow of costs from the processing department accounts into the finished goods accounts and then into the cost of goods sold account. The relevant accounts are as follows: Cost of Goods Sold Finished GoodsRolled Sheet Materials Finished GoodsSheared Sheet Factory OverheadSmelting Department Work in ProcessSmelting Department Factory OverheadRolling Department Work in ProcessRolling Department Factory OverheadConverting Department Work in ProcessConverting Departmentarrow_forwardFlowchart of accounts related to service and processing departments Alcoa Inc. is the world's largest producer of aluminum products. One product that Alcoa manufactures is aluminum .sheet products for the aerospace industry. The entire output of the Smelting Department is transferred to the Rolling Department. Part of the fully processed goods from the Rolling Department are sold as rolled sheet, and the remainder of the goods are transferred to the Converting Department for further processing into sheared sheet. Prepare a diagram using T accounts showing the flow of costs from the processing department accounts into the finished goods accounts and then into the cost of goods sold account. The relevant accounts are as follows: Cost of Goods Sold Materials Factory OverheadSmelting Department Factory OverheadRolling Department Factory OverheadConverting Department Finished GoodsRolled sheet Finished GoodsSheared Sheet Work in ProcessSmelting Department Work in ProcessRolling Department Work in ProcessConverting Departmentarrow_forwardFlowchart of accounts related to service and processing departments Alcoa Inc. is the worlds largest producer of aluminum products. One product that Alcoa manufactures is aluminum sheet products for the aerospace industry. The entire output of the Smelting Department is transferred to the Rolling Department Part of the fully processed goods from the Rolling Department are sold as rolled sheet, and the remainder of the goods are transferred to the Converting Department for further processing into sheared sheet Prepare a chart of the flow of costs from the processing department accounts into the finished goods accounts and then into the cost of goods sold account. The relevant accounts are as follows: Cost of Goods Sold Finished GoodsRolled Sheet Materials Finished GoodsSheared Sheet Factory OverheadSmelting Department Work in ProcessSmelting Department Factory OverheadRolling Department Work in ProcessRolling Department Factory OverheadConverting Department Work in ProcessConverting Departmentarrow_forward
- Flowchart of accounts related to service and processing departments Alcoa Inc. is the world's largest producer of aluminum products. One product that Alcoa manufactures is aluminum .sheet products for the aerospace industry. The entire output of the Smelting Department is transferred to the Rolling Department. Part of the fully processed goods from the Rolling Department are sold as rolled sheet, and the remainder of the goods are transferred to the Converting Department for further processing into sheared sheet. Prepare a diagram using T accounts showing the flow of costs from the processing department accounts into the finished goods accounts and then into the cost of goods sold account. The relevant accounts are as follows: Cost of Goods Sold Materials Factory OverheadSmelting Department Factory OverheadRolling Department Factory OverheadConverting Department Finished GoodsRolled sheet Finished GoodsSheared Sheet Work in ProcessSmelting Department Work in ProcessRolling Department Work in ProcessConverting Departmentarrow_forwardConstruct and interpret a product profitability report, allocating selling and administrative expenses Naper Inc. manufactures power equipment. Naper has two primary productsgenerators and air compressors. The following report was prepared by the controller for Napers senior marketing management for the year ended December 31: Generators Air Compressors Total Revenue 4,200,000 3,000,000 7,200,000 Cost of goods sold 2,940,000 2,100,000 5,040,000 Gross profit 1,260,000 900,000 2,160,000 Selling and administrative expenses 610,000 Income from operations 1,550,000 The marketing management team was concerned that the selling and administrative expenses were not traced to the products. Marketing management believed that some products consumed larger amounts of selling and administrative expense than did other products. To verify this, the controller was asked to prepare a complete product profitability report, using activity-based costing. The controller determined that selling and administrative expenses consisted of two activities: sales order processing and post-sale customer service. The controller was able to determine the activity base and activity rate for each activity, as follows: Activity Activity Base Activity Rate Sales order processing Sales orders 65 per sales order Post-sale customer service Service requests 200 per customer service request The controller determined the following activity-base usage information about each product: Generators Air Compressors Number of sales orders 3,000 4,000 Number of service requests 225 550 A. Determine the activity cost of each product for sales order processing and post-sale customer service activities. B. Use the information in (A) to prepare a complete product profitability report dated for the year ended December 31. Compute the gross profit to sales and the income from operations to sales percentages for each product. (Round to two decimal places.) C. Interpret the product profitability report. How should management respond to the report?arrow_forward
 Financial & Managerial AccountingAccountingISBN:9781337119207Author:Carl Warren, James M. Reeve, Jonathan DuchacPublisher:Cengage Learning
 AccountingAccountingISBN:9781337272094Author:WARREN, Carl S., Reeve, James M., Duchac, Jonathan E.Publisher:Cengage Learning,
 Financial & Managerial AccountingAccountingISBN:9781285866307Author:Carl Warren, James M. Reeve, Jonathan DuchacPublisher:Cengage Learning
 Accounting (Text Only)AccountingISBN:9781285743615Author:Carl Warren, James M. Reeve, Jonathan DuchacPublisher:Cengage Learning