
Microeconomics: Principles and Policy (MindTap Course List)
13th Edition
ISBN: 9781305280618
Author: William J. Baumol, Alan S. Blinder
Publisher: Cengage Learning
expand_more
expand_more
format_list_bulleted
Question
Chapter 1A, Problem 1TY
To determine
To draw:
A 2-variable diagram and measure the slope of line along with the meaning of the numbers.
Expert Solution & Answer
Explanation of Solution
Slope:
The slope represents the steepness of line or it is the ratio of the change in values on the Y-axis with respect to the X-axis.
The following graph plots the given data:
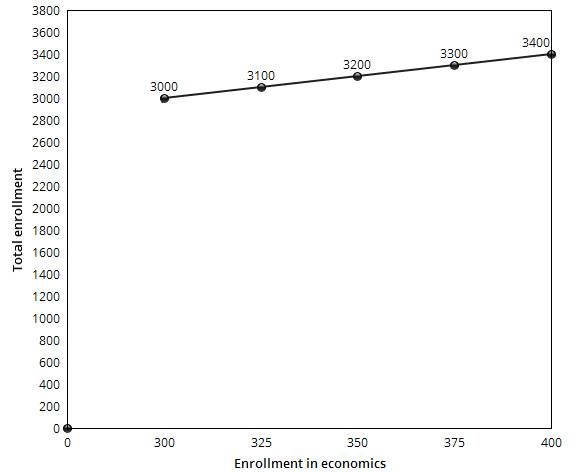
The slope of the line is the same as the horizontal change divided by vertical change.
The slope 4 shows that every 100 enrollment has 25 students of economics each year.
Want to see more full solutions like this?
Subscribe now to access step-by-step solutions to millions of textbook problems written by subject matter experts!
Students have asked these similar questions
The table gives information about the relationship between two variables, x and
y.
The relationship between x and y is ______ and the slope of the relationship ______ as x increases.
x
2
4
6
8
10
y
196
192
188
184
180
In the accompanying graph, is the slope of curve A A' positive or negative? Does the slope increase or decrease as we move along the curve from A to A'? Answer the same two questions for curve BB'.
In the accompanying graph, is the slope of curve AA′ positive or negative? Does the slope increase or decrease as we move along the curve from A to A′? Answer the same two questions for curve BB′.
Chapter 1A Solutions
Microeconomics: Principles and Policy (MindTap Course List)
Knowledge Booster

Similar questions
- In economics, what does the term ceteris paribus mean when analyzing the relationship between two variables? A. All other things being equal or held constant B. The direct relationship between two variables C. The inverse relationship between two variables D. The absence of any relationship between two variablesarrow_forwardWhich one of the following is not true about slope? A, It is vertical change over horizontal change B, The slope of a line represents the change in one variable that occurs when the other variable changes C, The slope of straight line between any two point on the line is negative D Slope= y2-y1/x2-x1arrow_forward
Recommended textbooks for you

 Macroeconomics: Principles and Policy (MindTap Co...EconomicsISBN:9781305280601Author:William J. Baumol, Alan S. BlinderPublisher:Cengage Learning
 Microeconomics: Principles & PolicyEconomicsISBN:9781337794992Author:William J. Baumol, Alan S. Blinder, John L. SolowPublisher:Cengage Learning


Macroeconomics: Principles and Policy (MindTap Co...
Economics
ISBN:9781305280601
Author:William J. Baumol, Alan S. Blinder
Publisher:Cengage Learning
Microeconomics: Principles & Policy
Economics
ISBN:9781337794992
Author:William J. Baumol, Alan S. Blinder, John L. Solow
Publisher:Cengage Learning