
EBK FOUNDATIONS OF ECONOMICS
8th Edition
ISBN: 9780134516196
Author: BADE
Publisher: PEARSON CO
expand_more
expand_more
format_list_bulleted
Videos
Textbook Question
thumb_up100%
Chapter 1.A, Problem 2SPP
The spreadsheet in Table 1 provides data on the U.S. economy: Column A is the year; the other columns are quantities sold in millions per year of compact discs (column B), music videos (column C), and singles downloads (column D). Use this spreadsheet to work Problems 1 and 2.
Table 1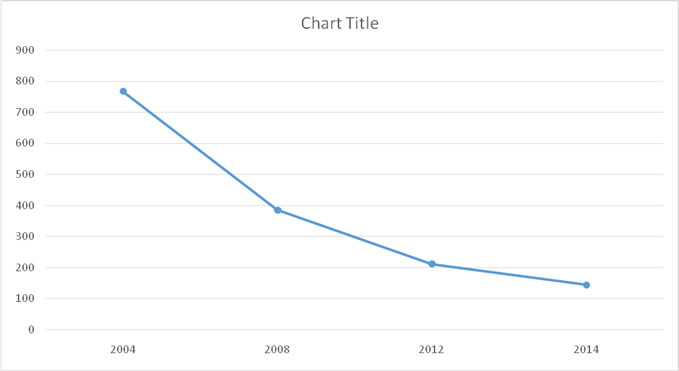
Draw a time-series graph of the quantity of compact discs sold. Say in which year or years the quantity sold (a) was highest, (b) was lowest, (c) increased the most, and (d) decreased the most.
If the data show a trend, describe it.
Expert Solution & Answer
Want to see the full answer?
Check out a sample textbook solution
Students have asked these similar questions
Based on the graph, how many recessions has France economy undergone over the years plotted in the chart? Remember shaded areas shows recession.
What are the two biggest recessions in terms of length and magnitude? 2020 is not included.
Decomposition of a time series of a souvenir shop's sales is shown in the plot below. Choose all of the following which are true for this time series
Select one or more:
a. The sales peak right before new year's
b. There are quarterly (3-monthly) seasonal cycles in this tie series
c. There is an increase trend in the time series
d. This time series is not stationary
e. There is no seasonality in this time series
Using a table and a line graph showing the unemployment and economic growth rate for Jamaica and Finland for the last 5 years. Examine the relationship observed between the two countries.
Chapter 1 Solutions
EBK FOUNDATIONS OF ECONOMICS
Ch. 1.A - Prob. 1SPPCh. 1.A - The spreadsheet in Table 1 provides data on the...Ch. 1.A - Prob. 3SPPCh. 1.A - Prob. 4SPPCh. 1.A - Draw a scatter diagram to show the relationship...Ch. 1.A - Draw a time-series graph of the quantity of music...Ch. 1.A - Prob. 3IAPCh. 1.A - Prob. 4IAPCh. 1.A - Prob. 5IAPCh. 1 - Prob. 1SPPA
Ch. 1 - Prob. 2SPPACh. 1 - Prob. 3SPPACh. 1 - Prob. 4SPPACh. 1 - Prob. 5SPPACh. 1 - Prob. 6SPPACh. 1 - Prob. 7SPPACh. 1 - Prob. 8SPPACh. 1 - Prob. 9SPPACh. 1 - Prob. 10SPPACh. 1 - Prob. 11SPPACh. 1 - Prob. 12SPPACh. 1 - Prob. 13SPPACh. 1 - Prob. 1IAPACh. 1 - Prob. 2IAPACh. 1 - Prob. 3IAPACh. 1 - Prob. 4IAPACh. 1 - Prob. 5IAPACh. 1 - Prob. 6IAPACh. 1 - Prob. 7IAPACh. 1 - Prob. 8IAPACh. 1 - Prob. 9IAPACh. 1 - Prob. 10IAPACh. 1 - Prob. 11IAPACh. 1 - Prob. 12IAPACh. 1 - Prob. 1MCQCh. 1 - Prob. 2MCQCh. 1 - Prob. 3MCQCh. 1 - Prob. 4MCQCh. 1 - Prob. 5MCQCh. 1 - Prob. 6MCQCh. 1 - Prob. 7MCQCh. 1 - Prob. 8MCQ
Knowledge Booster


Learn more about
Need a deep-dive on the concept behind this application? Look no further. Learn more about this topic, economics and related others by exploring similar questions and additional content below.Similar questions
- If you plot temperature on the y axis and time on the x axis, you have created a A. bar chart. B. scatter plot. C. time series. D. pie chart.arrow_forwardRefer to the data file to answer the following questions. 1. Calculate the Gross Domestic Product (GDP) at current prices for each quarter.arrow_forwardDefine and briefly explain the nature and structure of the following terms. Cross sectional data and time series data.arrow_forward
- Studying Agricultural GDP in Turkey from 1980 to 2020 is an example of usinga.pooled datab.panel datac.cross sectional data d.time series dataarrow_forwardWhat is meant by the seasonal adjustment of a time series? Explain why government agencies expend a large amount of effort on the seasonal adjustment of economic time series.arrow_forwardHow would you describe this data?arrow_forward
- You are given the following dataset from a sample of the population. Superhero Number of Villains Captured Number of Losses Average Hours of Sleep Spiderham 30 9 12 Alligator Loki 50 1 23 Iron Man 20 8 6 Phil Coulson 18 2 8 Yelena Belova 25 5 2 Round all answers to 2 decimal places. IE: 3.567 = 3.57 A. What kind of dataset is this? Answer either Panel, Time series, or cross sectional B. Calculate the average number of villains captured in this sample. C. Calculate the variance of the number of villains captured in this sample. D. Calculate the correlation between the number of villains captured and average hours of sleep . If answer is negative, include negative sign. E. Calculate the sample covariance between the average number of losses and average hours of sleep . If answer is negative, include negative sign.arrow_forwardNeed more explanation by considerinng the data given in snapshotsarrow_forwardQ 11. Which of the following is an example of time series data? a. Data on the number of vacancies in various departments of an organization in a particular month b. Data on the consumption of wheat by 200 households during a year c. Data on the unemployment rates in different parts of a country during a year d. Data on the gross domestic product of a country over a period of 10 yearsarrow_forward
- question 8 macroneconarrow_forwardIf possible please use uniform series and geometric/arithmetic series with the table to solve the problems!arrow_forwardThe following table lists the number of daily visitors to the Web site of a new business during its first year. Month Number Month Number 1 2 3 4 5 6 5,400 5,372 5,265 5,250 5,289 5,350 7 8 9 10 11 12 5,600 5,520 5,280 5,400 5,448 5,500 a. Graph the data with a time-series plot using a vertical scale from 5,000 to 5,700.b. Graph the data with a time-series plot using a vertical scale from 4,000 to 7,000. c. Comment on the difference between these two time-series plots.arrow_forward
arrow_back_ios
SEE MORE QUESTIONS
arrow_forward_ios
Recommended textbooks for you
 Microeconomics: Principles & PolicyEconomicsISBN:9781337794992Author:William J. Baumol, Alan S. Blinder, John L. SolowPublisher:Cengage Learning
Microeconomics: Principles & Policy
Economics
ISBN:9781337794992
Author:William J. Baumol, Alan S. Blinder, John L. Solow
Publisher:Cengage Learning
Forecasting: Exponential Smoothing, MSE; Author: Joshua Emmanuel;https://www.youtube.com/watch?v=k_HN0wOKDd0;License: Standard Youtube License