
Concept explainers
The price at which the amount demanded equals 15 billion bushels per year and shows the
Explanation of Solution
The demand function for corn is given below:
Substitute the respective values in Equation (1) to calculate Y axis value or the price of corn.
The price of corn is $9.5.
The X axis value or quantity demanded for corn is calculated as follows using Equation (1):
The quantity demanded for corn is 19 units.
To calculate the price at which the amount demanded equals 15 billion bushels per year, substitute the quantity demanded as 15 in Equation (1).
The price of corn when the demand is equal to 15 billion bushels is $2.
The demand curve for corn is shown below:
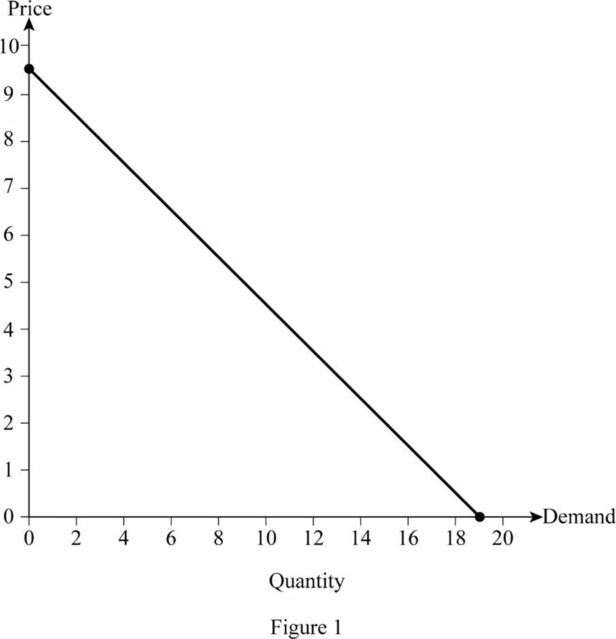
In Figure 1, the vertical axis measures the price of corn and horizontal axis measures the quantity demanded. The downward sloping curve is the demand curve for corn. From this figure, it is clear that the price of corn for 19 units of corn is $9.6.
Demand: Demand refers to the total value of goods and services that are demanded at a particular price in a given period of time.
Demand curve: The demand curve shows the quantity demanded at different price levels. There is a negative relationship between the price and quantity demanded and the demand curve slopes downward.
Want to see more full solutions like this?
Chapter 2 Solutions
Microeconomics


- (Calculating Price Elasticity of Demand) Suppose that 50 units of a good are demanded at a price of Si per unit. A reduction in price to $0.20 results in an increase in quantity demanded to 70 units. Using the midpoint formula, show that these data yield a price elasticity of 0.25. By what percentage would a 10 percent rise in the price reduce the quantity demanded, assuming price elasticity remains constant along the demand curve?arrow_forwardFor each of the determinants of demand in Equation 2.1, identify an example illustrating the effect on the demand for hybrid gasoline-electric vehicles such as the Toyota Prius. Then do the same for each of the determinants of supply in Equation 2.2. In each instance, would equilibrium market price increase or decrease? Consider substitutes such as plug-in hybrids, the Nissan Leaf and Chevy Volt, and complements such as gasoline and lithium ion laptop computer batteries.arrow_forward


 Economics (MindTap Course List)EconomicsISBN:9781337617383Author:Roger A. ArnoldPublisher:Cengage Learning
 Managerial Economics: Applications, Strategies an...EconomicsISBN:9781305506381Author:James R. McGuigan, R. Charles Moyer, Frederick H.deB. HarrisPublisher:Cengage Learning