
Videos
(a)
To find: To estimate the relative frequency of the shaded area by eye.
(a)
Answer to Problem 1PP
The relative frequency of the shaded area is
Explanation of Solution
Given:
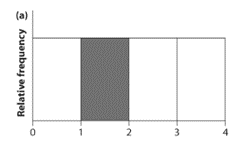
Calculation:.The area of the rectangular bar of a histogram is proportional to the relative frequency of the considering numerical variable.
Interpretation:As the area of the rectangular bar of the histogram proportional to the relative frequency, the area of the shaded bar should be estimated by eye, comparing to the total area of the graph. The width of each bar of the histogram is equal to one another. Therefore the area of the shaded part is about one-fourth of the total area of the graph. Therefore the relative frequency of the shaded area is
(b)
To find: To estimate the relative frequency of the shaded area by eye.
(b)
Answer to Problem 1PP
The relative frequency of the shaded area is
Explanation of Solution
Given:
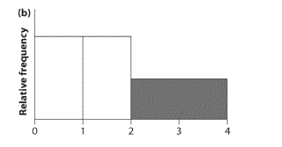
Calculation:.The area of the rectangular bar of a histogram is proportional to the relative frequency of the considering numerical variable.
Interpretation: As the area of the rectangular bar of the histogram proportional to the relative frequency, the area of the shaded bar should be estimated by eye, comparing to the total area of the graph. The width of each bar of the histogram is equal to one another and height of last two bars is exactly half of first two bars. Which makes the total area of last two bars equal to one complete bar. Therefore the area of the shaded part is about one-third of the total area of the graph. Therefore the relative frequency of the shaded area is
(c)
To find: To estimate the relative frequency of the shaded area by eye.
(c)
Answer to Problem 1PP
The relative frequency of the shaded area is
Explanation of Solution
Given:
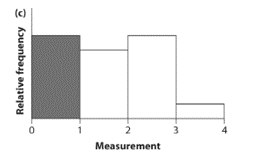
Calculation:. The area of the rectangular bar of a histogram is proportional to the relative frequency of the considering numerical variable.
Interpretation: As the area of the rectangular bar of the histogram proportional to the relative frequency, the area of the shaded bar should be estimated by eye, comparing to the total area of the graph. The width of each bar of the histogram is equal to one another. Therefore the area of the shaded part is about one-third of the total area of the graph. Therefore the relative frequency of the shaded area is
Want to see more full solutions like this?
Chapter 2 Solutions
The Analysis of Biological Data


 Holt Mcdougal Larson Pre-algebra: Student Edition...AlgebraISBN:9780547587776Author:HOLT MCDOUGALPublisher:HOLT MCDOUGAL
 Glencoe Algebra 1, Student Edition, 9780079039897...AlgebraISBN:9780079039897Author:CarterPublisher:McGraw Hill
 Big Ideas Math A Bridge To Success Algebra 1: Stu...AlgebraISBN:9781680331141Author:HOUGHTON MIFFLIN HARCOURTPublisher:Houghton Mifflin Harcourt